Work Item Age is the elapsed time since the work item started. It is one of four key flow metrics alongside Cycle Time, Throughput, and WIP. Of the four flow metrics it is, arguably, the most important because controlling age is a key way to improve process predictability.
ActionableAgile provides a feature-rich Aging Work in Progress chart to help you measure and control Work Item Age.
The Aging Work In Progress Chart
The Aging Work in Progress chart is a lot like a visual board as the columns reflect your workflow stages and the items show as dots in the appropriate column.
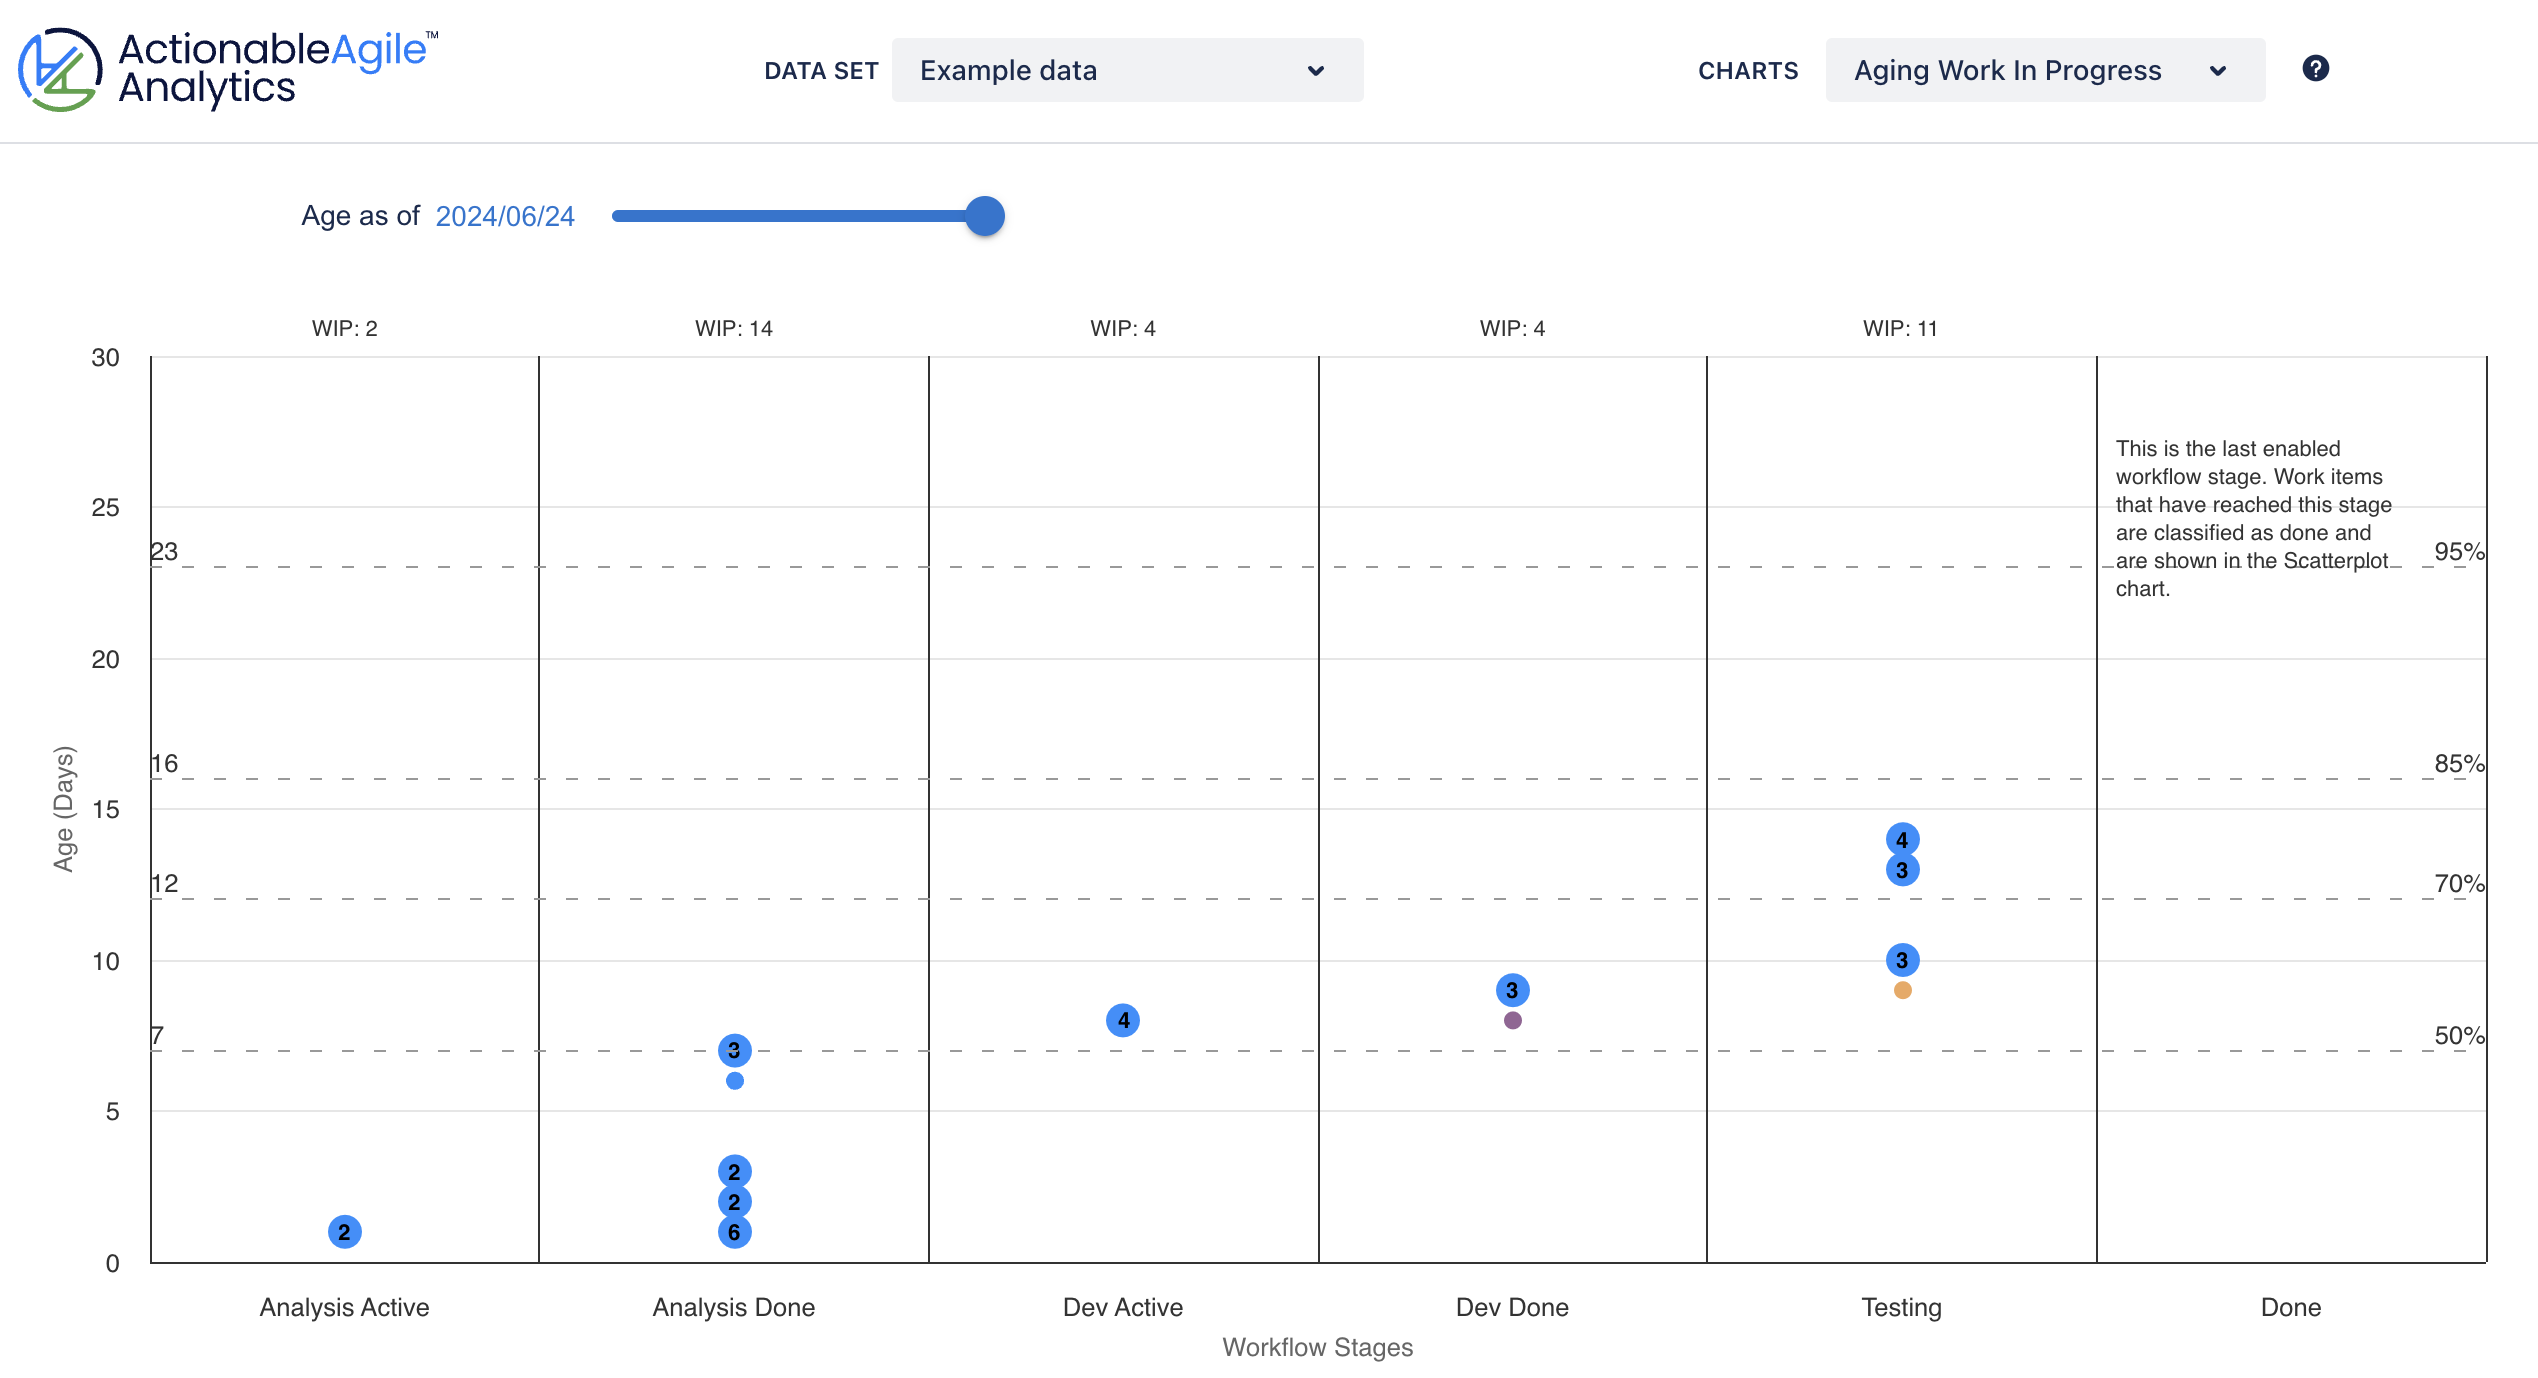
The vertical placement of the dot reflects the items Work Item Age. A dot may reflect more than one work item if they are in the same workflow stage and have the same Work Item Age.
How to use the chart to manage Work Item Age
Only while an item appears on this chart can you exert any control over where it will end up in your Cycle Time data. If you look at the last column of this chart you will notice that there are no work items represented. When an item reaches this workflow stage, it is complete and appears as historical data on your Cycle Time Scatterplot instead. Nothing you do now can change how long it took to complete that item.
Because you use Cycle Time data to answer “How long will it take?” for a single work item, Work Item Age should be a key consideration when making your plan for the day. But, knowing the age of a work item isn’t enough information on its own. In order to know if the age of a work item is bad, good, or indifferent you need context. ActionableAgile overlays percentile lines from the Cycle Time data to add this context right where you need it.
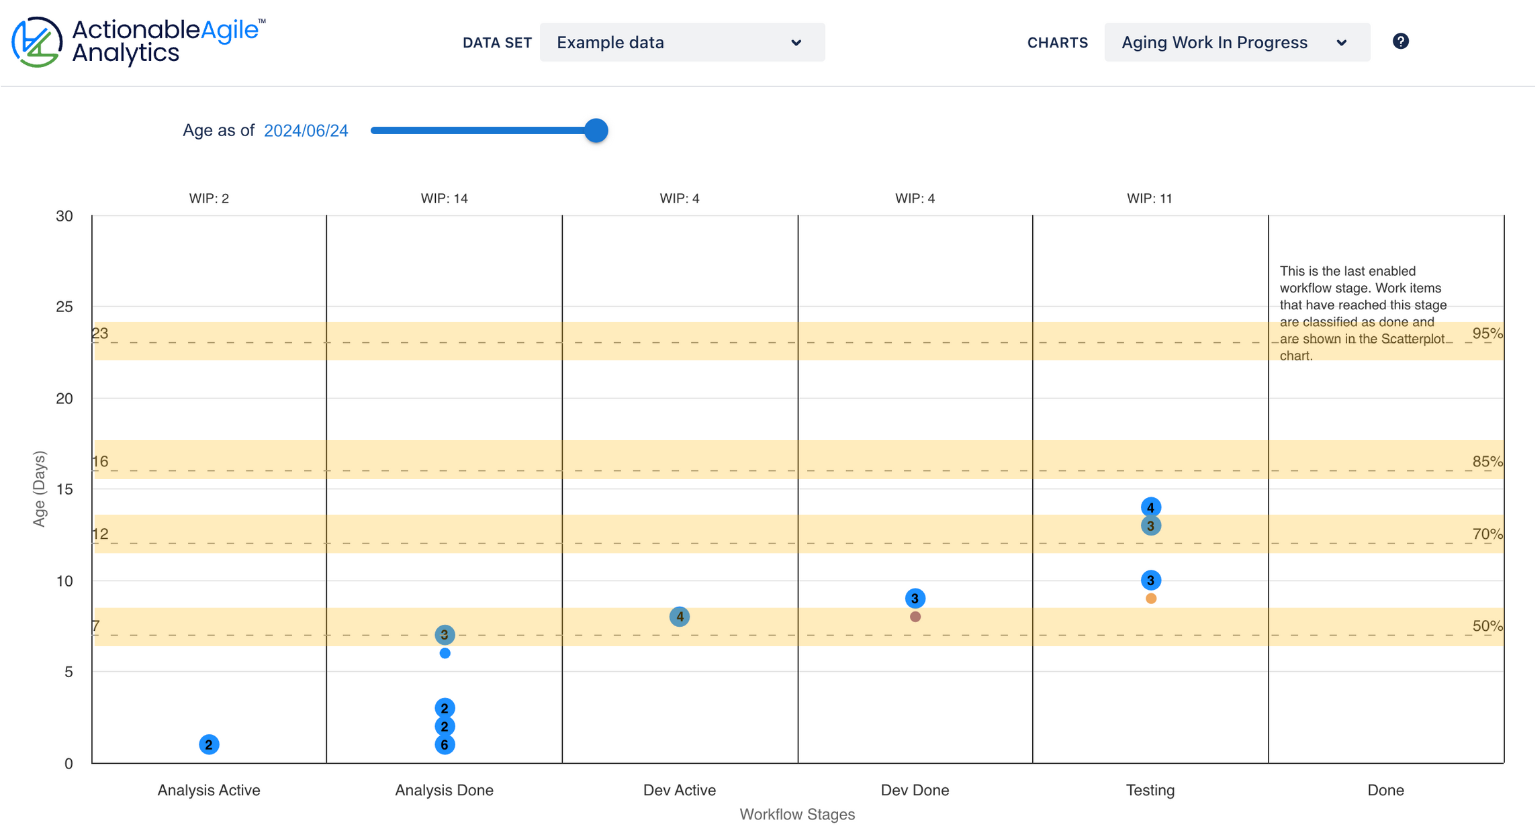
In the image above below you can see that 85% of past items have finished in 16 days or less. Now, you can keep that in mind as you track work items and make daily plans. If you want to maintain that level of predictability, you’ll need to continue to finish 85% of work items in 16 days or less.
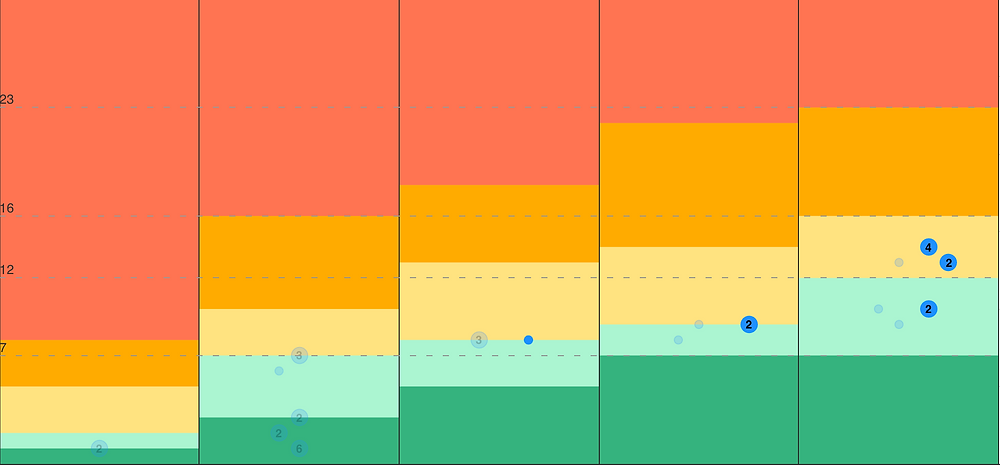
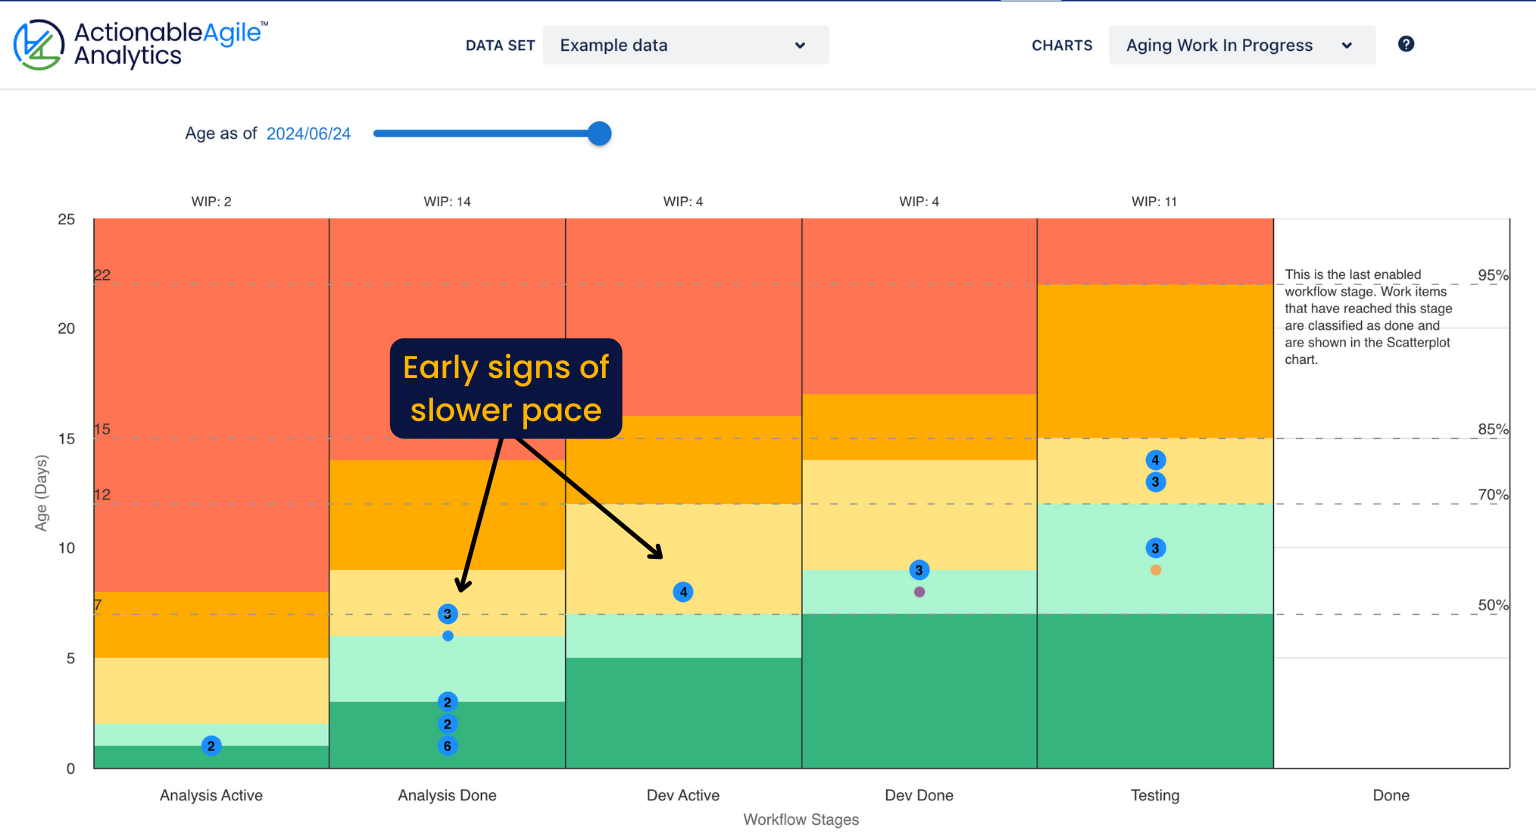
Getting early signals of slow work
It's easy to know if an item near the end of the workflow is in danger of finishing beyond the desired age. Knowing that about items early in the workflow is more difficult. ActionableAgile’s pace percentiles help provide early signals that work is moving at a slower pace than past work.
Learn more about the Aging Work in Progress chart and the various chart controls in our product documentation.
In Summary...
If you can only measure and manage one thing, make it Work Item Age. At its core, Work Item Age is a process improvement metric.
When you see items aging more than expected, you can experiment with tactics to see if they help. There is no single fix but common tactics include limiting WIP, controlling work item size, reducing dependencies, and more.
Once you manage Work Item Age, your Cycle Time data should stabilize and make forecasting easier!
Excited to explore flow with your team? Try ActionableAgile for free today and reach out if you need any help via our support portal.