About Spektrix
Spektrix is a complete solution for ticketing, marketing, fundraising, and CRM, designed specifically for the performing arts and events industry. With world-class technology and support, Spektrix helps 750+ organisations across the UK, Ireland, US, and Canada to grow their revenue and deepen customer relationships. Powerful, intuitive software, at-a-glance insights, frequent and seamless upgrades, training, support, and strategic consultation with experienced professionals come at no additional cost - making Spektrix the fastest-growing solution for arts organisations today.
Introducing Rita Goodbody and her role within Spektrix

Rita joined Spektrix in 2022 as an Agile Delivery Manager during a period of significant growth for the company. When she began, Spektrix had just three engineering teams; today, it boasts eight. Her role is dynamic, with no two days alike, but her overarching focus is on delivering value to end users and customers.
Rita’s responsibilities span across two teams, including one focused on architectural and technical long-term vision. She also collaborates regularly with a group of delivery managers, exchanging insights on improving delivery processes and supporting team efficiency. Central to her work is enabling the flow of work, fostering continuous improvement, and providing clarity to stakeholders about delivery timelines.
Spektrix utilizes Kanban and Lean practices, emphasizing continuous forecasting to maintain accountability and transparent communication. Tools like Jira and Confluence are integral to their workflow, allowing the team to manage work seamlessly and link delivery metrics with strategic goals. This structure ensures that all stakeholders have a clear view of how individual efforts contribute to larger company objectives.
For Rita, the role of an Agile Delivery Manager is about more than just achieving goals—it’s about empowering teams, enabling flow, and making work happen.
Background
Spektrix began leveraging ActionableAgile® Analytics in Jira Cloud in mid-2023 as part of their commitment to optimizing delivery processes and enabling their teams to deliver value more effectively. This tool has become a cornerstone of their workflow, helping them align their growing teams with strategic goals and maintain transparency across the organization.
The Situation
Teams within Spektrix were structured similarly, typically comprising six to nine people with roles including engineers, product owners, delivery managers, tech leads and engineering managers.
Delivery teams worked with different focuses—some tackling long-term architectural initiatives, others concentrating on short-term features. This diversity of efforts demanded clear alignment and a reliable way to track progress.
Much of the work at Spektrix relied on manual processes, particularly when it came to tracking, forecasting, and providing updates to stakeholders. Delivery managers like Rita spent significant time preparing data manually. "We used to spend hours doing spreadsheets,” she explained.
This manual approach involved extracting data from Jira and inputting it into spreadsheets for forecasting and reporting. While effective for a smaller team size, the process became a bottleneck as the number of teams grew. Simple tasks like answering stakeholder questions often required substantial time.
Growing Pains: Scaling Teams and Processes
As the teams expanded, the inefficiencies of manual processes became increasingly apparent. Delivery managers found themselves struggling to provide consistent updates, and the manual workflows made it difficult to keep pace with the demands of a growing organization.
Each Delivery Manager had 2 teams. Switching context from one team to another took time to get everything loaded and ready for the update. On average the Delivery Managers would spend 2-4 hours getting the data right and being able to update all relevant information to reflect the latest progress.
It was clear Spektrix needed a way to streamline its processes and reduce the reliance on time-consuming methods that no longer served its scale.
Rita reflected on the transition: “We were spending so much time doing manual spreadsheets, updating data, and preparing forecasts. It was taking too long, and as we grew, it was clear something needed to change.’’
Challenges of Growing Complexity
The diversity of Spektrix’s teams and their varying focuses further complicated efforts to maintain alignment. Without a unified approach to tracking and forecasting, teams and stakeholders often worked with incomplete or inconsistent information. Rita described the need for better visibility and alignment: “Each team works slightly differently, but we all needed to look at the same information to stay on track and ensure we were delivering value.”
This lack of cohesion impacted both day-to-day operations and longer-term planning, underscoring the need for a scalable solution to manage the growing complexity.
Implementing ActionableAgile® Analytics - What happened after?
The rollout of ActionableAgile® Analytics at Spektrix was a gradual but transformative process, beginning with the delivery managers and expanding across teams. The initial goal was to replace the manual, spreadsheet-driven workflows that consumed significant time and effort.
To secure approval for the business case, Rita utilized the tool during the free trial period to demonstrate its value. She emphasized that the time savings it provided far outweighed the cost of the tool. Additionally, she highlighted how the team could self-serve and access quick updates at a team level, making the decision to invest in the tool an easy choice.
First the teams wanted to make sure they had the same information and results as the manual data. We've always used flow metrics, core to Kanban, but ActionableAgile® Analytics allowed us to use it more transparently by everyone in engineering rather than just delivery managers with complex and brittle spreadsheets. ActionableAgile® Analytics gives us more ways to examine teams delivery from different angles with more dynamic and automated views.
Starting with the Delivery Managers
Rita described how the implementation began with delivery managers exploring the tool together. “We just got together as delivery managers and said, ‘Okay, let’s set this up in our teams. We compared how things worked, ran demos for each other, and started spreading it slowly,” she explained. Initially, delivery managers were the primary users, testing the tool and identifying how best to introduce it to their teams.
Teams within Spektrix were structured similarly, typically comprising six to nine people with roles including engineers, product owners, delivery managers, and tech leads. This provided a consistent framework for implementing ActionableAgile® Analytics while tailoring its use to the needs of individual teams.
Building Engagement Across Teams
The next step was to share the tool with team leads and engineers, demonstrating how it could help with planning and forecasting. According to Rita, the response was overwhelmingly positive. “The leads were really engaged. They were like, ‘Wow, this is brilliant—we can get information so quickly.’”
The adoption process varied across teams. Some quickly embraced flow metrics like work item age and cycle time, incorporating them into daily stand-ups and using them to identify bottlenecks. Others preferred a focus on long-term metrics, analyzing historical data to identify trends and opportunities for improvement.
In one of Rita’s teams, the use of flow metrics sparked proactive collaboration. “They were like, ‘Can you call us out when something hits three or four days? We do forget to look at it.’ So I’d flag aging items, and that really helped us reduce cycle times. When you look at the historical data, we went from high cycle times all the way down. That momentum motivated the team,” she shared.

Unlocking Time and Focus
For delivery managers at Spektrix, implementing ActionableAgile® Analytics was a game-changer, particularly in terms of saving time. Before, hours were spent manually updating spreadsheets to track and forecast delivery timelines. “We realized we were saving so much time,” Rita explained. “Now, instead of spending Monday mornings buried in Excel, we can use that time for more valuable work.”
The shift not only freed up delivery managers but also allowed teams to focus on improving their workflows. Rita highlighted how this shift built momentum. “We started sharing metrics like cycle time with the teams, and over time, they saw real improvements. When you look at the historical data, we went from high cycle times all the way down. That momentum motivated the team to keep improving.”
In one of the teams, we went from 16-18 days under 85% confidence level to 6-8 days under 85% confidence in less than 3 months time. See below snapshot.
Delivering a Critical Feature—On Time
One standout moment came in 2023, when Spektrix faced a tight deadline for an important feature release. Rita and her team were able to quickly identify that the current setup wouldn’t allow them to meet the deadline. “Using the tool, we forecasted that we wouldn’t make it without additional support. We brought in help from other teams and managed to deliver on time,” Rita said.
The feature was delivered as planned, sparking applause from across the company. “Everyone was happy and clapping,” she recalled.
A Shift in Culture
The adoption of ActionableAgile® Analytics sparked a cultural shift at Spektrix. Delivery managers moved from being gatekeepers of data to enablers of transparency and flow. Teams grew more independent, and shared metrics became a common language.
“We started sharing screenshots and updates regularly, whether in chats or meetings. Teams could see their progress, and it created this momentum,” Rita said. “The real magic is when people pull the information themselves. Instead of us pushing it onto them, they’re asking questions, getting curious, and taking action.”
Real Cycle Time data from one of the teams as at December 2022 - Prior to using ActionableAgile® Analytics
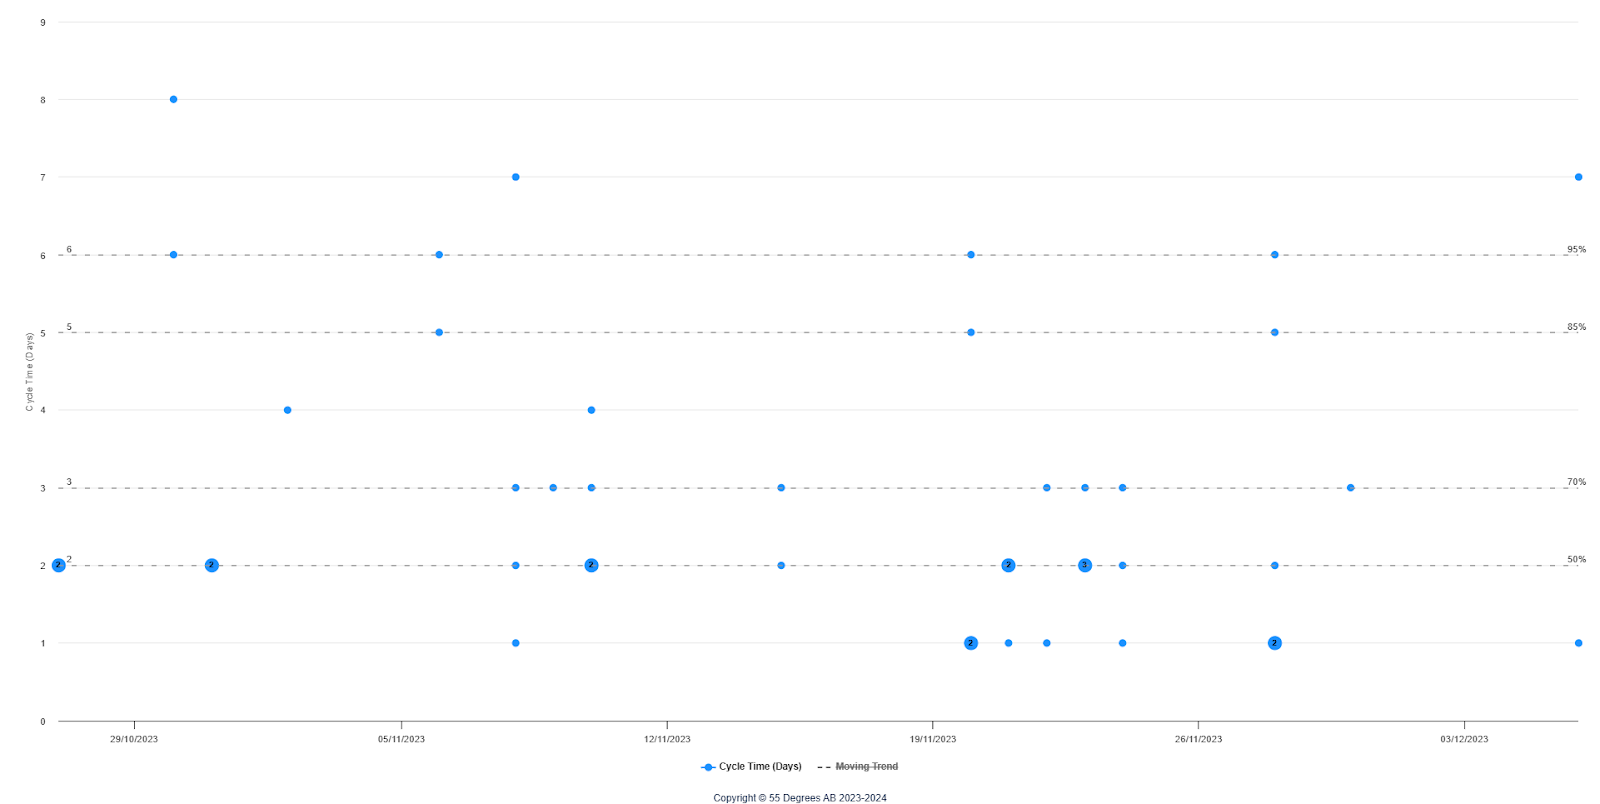
Real Cycle Time data from the same team as at December 2023 - 8 months following the installation of ActionableAgile® Analytics
Above, we can see the same team's Cycle Time exactly a year apart. By analyzing the data, we can draw the following conclusions:
Consistent Delivery in 2023 Compared to 2022
The 2023 chart shows more clustering of cycle times around lower percentile bands (e.g., 50% and 70%) compared to 2022. This indicates improved consistency in delivery times, enabling stakeholders to better predict when work will be completed.
Faster Cycle Times in 2023
Median cycle times (represented near the 50% band) in 2023 appear lower than in 2022. This suggests that the team improved their overall efficiency, reducing the time it takes to deliver items from start to finish.
Fewer Outliers in 2023
In 2022, there are more visible dots above the higher percentile bands (e.g., 95%), reflecting more frequent long-running work items. By 2023, the team reduced the number of outliers, demonstrating their success in addressing bottlenecks and managing complex tasks more effectively.
Increased Work Volume in 2023 While Maintaining or Improving Cycle Time
The 2023 chart shows a larger number of data points (and potentially larger dots) compared to 2022, suggesting the team handled a greater volume of work. Despite this increased workload, the team maintained or improved their cycle times, showcasing scalability and adaptability.

Summary of Outcomes
Significant Time Savings allowing for work on more valuable projects
Improved Cycle Times
On-Time Delivery for Critical Features
Increased Team Accountability
Enhanced Stakeholder Confidence
What Does the Future Look Like for Spektrix?
Establishing Transparency and Collaboration Across Teams
Looking forward, Spektrix envisions a future where transparency and flow metrics are integrated not just at the team level but across the entire organization. Rita highlighted a growing need for cross-team visibility, especially as dependencies and collaborative goals become more prevalent.
“We’d love to see a dashboard that brings together data from multiple teams in one place,” Rita said. “Right now, if one team’s work blocks another, we have to gather data manually from different delivery managers. It would be amazing to see trends across teams at a glance to quickly understand where dependencies or bottlenecks are happening.”
This vision aligns with Spektrix’s efforts to scale their use of tools like Jira and ActionableAgile® Analytics beyond engineering teams to other areas.
As Spektrix explores future possibilities, the balance between automation and meaningful conversations remains critical. While some team members have suggested features like AI-driven insights to identify trends and optimize throughput automatically, Rita reflected on the value of keeping discussions at the forefront.
“I love going into the data, looking at the past two weeks, and prompting the team with questions,” she explained. “Why did this happen? Was this good or bad? That conversation piece is so valuable. If we rely too much on automation, we might lose that depth of understanding.”
Championing Flow Across the Organization
Spektrix plans to champion the adoption of flow metrics and tools like ActionableAgile® Analytics across the company, embedding these practices into all teams and processes.
Rita believes this will help achieve broader alignment with company goals. “At some point, we’ll want to centralize how we use tools across the company, ensuring everyone benefits from the same efficiencies and insights,” she shared.
By continuing to foster collaboration, refining their use of flow metrics, and expanding tool adoption, Spektrix is paving the way for a future where agility and transparency drive success at every level.