Adopting flow metrics can feel like trying to convince your team to give up coffee......difficult and a little dangerous. But it doesn't have to be.
In our recent webinar with ProKanban.org, we tackled the big questions: How do we overcome resistance? How do we make flow metrics meaningful to teams? And how do we introduce them without causing mass panic?
Here are the key takeaways to help you build buy-in without breaking trust.
Bringing Flow Metrics to Your Team
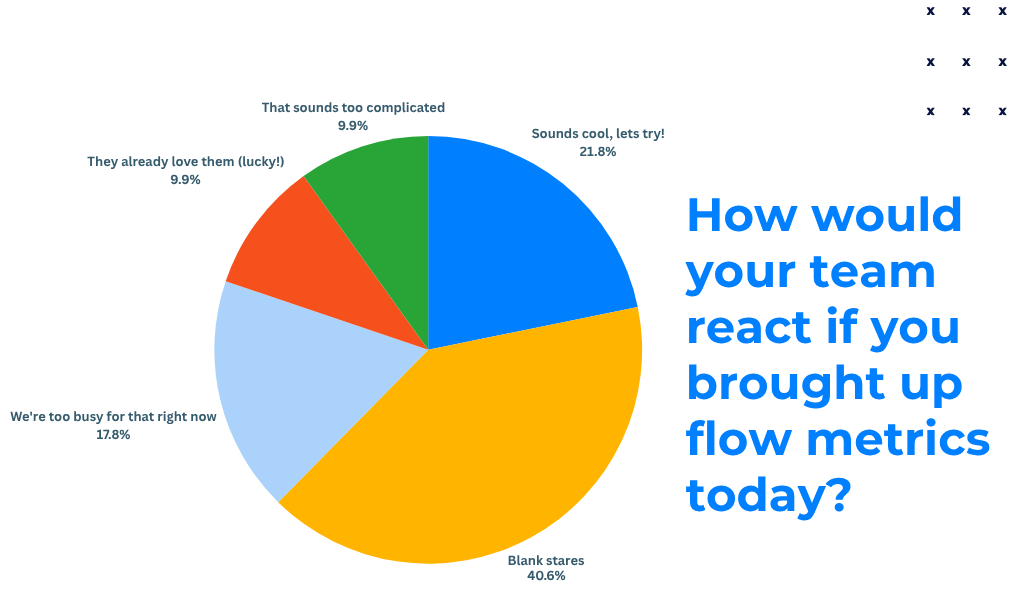
What’s the best way to introduce flow metrics to a team that’s never used them? You might worry that if you suddenly start talking about cycle times and throughput, you’ll get blank stares – and you’re probably right.
Rita suggests a gradual, data-informed approach to get buy-in:
“If you come straight into a stand-up and say, ‘ from now on we’re going to use flow metrics ,’ you’ll get probably blank stares… People will wonder what’s happening.”
Instead, begin collecting some data in parallel to your current process. Start measuring how long your work is actually taking and how much you’re delivering. “I started to look at the metrics… I thought, oh, what’s happening here? We have a lot of variation,” Rita says, describing her own journey. She brought these findings into a retrospective, using real data from the last few weeks to reflect on how work was flowing.
The key is to introduce flow metrics gradually as helpful information, not as a sudden mandate. You might start by examining recent cycle times and throughput in retrospectives or sprint reviews (looking at historical data is a lagging measure).
As the team becomes more comfortable, you can begin using leading indicators like work item age during daily stand-ups. For example, some teams add an aging marker on cards in their Jira or Kanban board to highlight items that have been in progress longer than a few days.
How to deal with the Story Points discussion
Many Scrum teams are used to estimating in story points (with tools like planning poker or Fibonacci sequences) and using velocity for planning. A common question is how flow metrics relate to or replace these practices.
The experience shared by our experts is that you don’t need to estimate in points to have useful predictions, in fact, your real historical data is usually more accurate than a guess.
That said, do not abandon the valuable discussions that happen during refinement and planning. The goal is to shift those conversations toward understanding the work and risks, rather than debating estimates.
Rita went into some detail about this -
“ Absolutely do not drop conversations about risks and alignment and what needs to be done. But to sit there and spend time on ‘how long do you think this will take?’ – that’s where we dropped it .”
In her team, they stopped arbitrary story point estimates, but they still collaboratively discuss each upcoming story to make sure they understand it and that it’s small enough. Once the team is clear on the what and why of a story, they start the work. How long it actually takes (the cycle time) is then fed back into their metrics.
Over time, teams often find that story point estimates don’t add much value beyond what their throughput and cycle time data already tell them. Colleen recommends doing refinement as close as possible to when the work will start, to incorporate the latest information.
Planning far in advance with estimates that might change can be wasteful. Instead, teams can forecast using flow metrics: for example, using throughput to project how many stories they can likely complete in the next iteration, or using historical cycle time percentiles to answer “when might this single item be done?” (often via Service Level Expectations, like “85% of our stories get done in ≤8 days”).
These forecasts are based on reality which is the actual variability of past performance, rather than the optimistic assumptions that often creep into estimates.
Smaller Batches, Faster Flow
Another aspect of improving flow is tackling the batch size of work. Intuitively, one small item will move through the system faster than a large batch of work. Colleen emphasizes this when addressing how to explain the benefit of moving one item faster versus a group of items:
“One item is always going to be faster, obviously, than a group of items… The bigger [the batch], the slower it tends to move.” Large projects or epics that comprise many pieces will inevitably take longer and face more complexity than a single, well-defined story.
The takeaway: whenever possible, break work into smaller independent chunks. Each chunk (perhaps a user story) should ideally deliver some value on its own.
By keeping batch size small, you can deliver pieces incrementally and get feedback sooner. If you have an 8–12 week epic, try to slice it into smaller features or stories that can be completed and released continuously, rather than waiting 3 months for a big bang.
Smaller batches moving through the system quickly will improve overall throughput and help maintain that consistency we discussed above.
Common Challenges and Misconceptions
“Our data is messy or not good enough.”
Many teams worry that their tracking data (e.g. in Jira) is incomplete or inconsistent, and thus hesitate to use it. In reality, your data is what it is – and that’s okay. “The data you have is reflective of the system you have,” Colleen notes, meaning it captures all the variability of your current process.
That variability is precisely why forecasts often feel hard! Don’t wait for perfect data; instead, start using what you have to set a baseline. Include all those outliers and long cycle times in your analysis – they’re telling you something important about your process. Over time, as your team improves (maybe by slicing work smaller or reducing dependencies), your data will naturally get “cleaner” (more consistent).
But even if you have a wide range of outcomes, techniques like Monte Carlo simulations can ingest that and give a probability-based forecast. In short, “If you have data, it’s good data.” Use it to start the conversation and drive change.
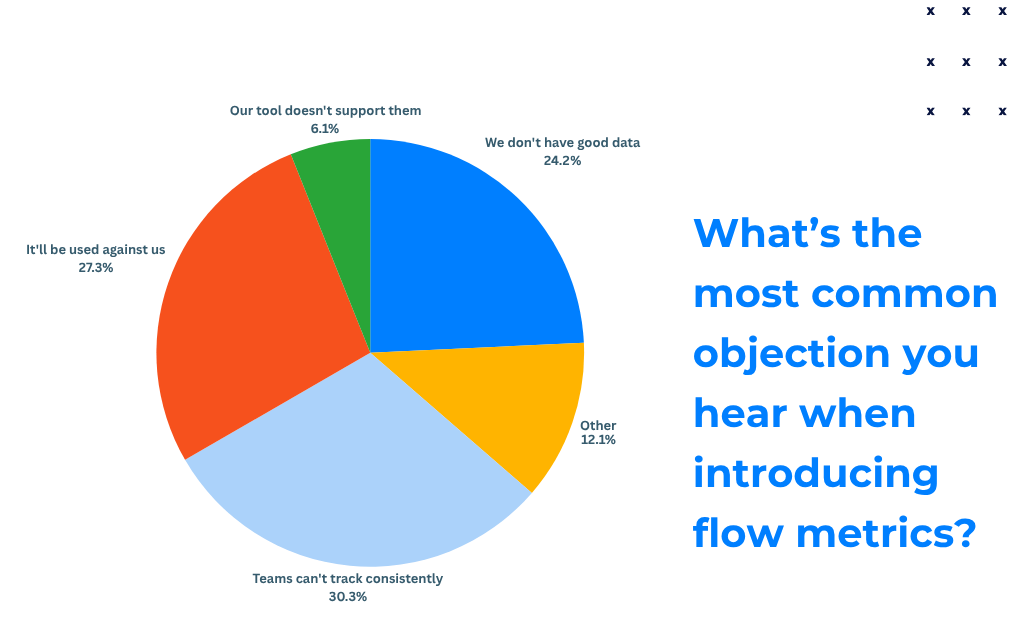
“Won’t management use these metrics against us?”
Perhaps the biggest fear is that making all this data transparent will turn into a surveillance mechanism or a blame game. This concern is real – it’s crucial to establish psychological safety and an improvement-oriented culture when introducing flow metrics.
Colleen emphasizes that metrics should be a tool for the team first and foremost, not a stick for leaders to poke at individuals. The goal of visualizing flow metrics is to help the team make better decisions in real time (like swarming aging work or adjusting WIP), and to experiment with changes for improvement. It’s not to compare Team A vs Team B, or Developer X vs Developer Y.
Make sure leadership understands this too. Ideally, managers should look at metrics like cycle time and throughput as indicators of process health, not employee effort. If a number is outside the expected range, the question to ask is “What’s affecting our workflow here?” rather than “Who is to blame?”
Want to Learn More?
If you're ready to keep going, check out: