If you’re tracking OKRs solely with Jira’s built-in reports, you’re steering your team using outdated snapshots rather than real-time insights. Jira may display metrics, but it lacks the tools necessary to identify what’s slowing progress, where tasks stall, or whether you’re truly on track to meet your goals.
Without answers to these questions, you’re left reacting to issues rather than proactively addressing them.
To stop navigating with outdated data, you need tools specifically designed to work with OKRs. With Oboard and ActionableAgile® Analytics, you can move from passive tracking to proactive execution. In other words, you get to fix issues before they derail your goals.
And yes, Jira offers free reports, such as Control Charts and Cumulative Flow Diagrams (CFDs). And you might think that they are enough. But let’s be honest — do they tell you what you need to know?
Four Things Jira Won’t Tell You
Are we on track to meet our key results?
What’s slowing us down?
Where are work items piling up?
If we continue at this pace, will we succeed?
If you’re serious about hitting your OKRs, you need answers to these questions. And Jira won’t tell you any of this. At its absolute best, it will provide you with circumstantial data from which you can extrapolate the real answers, but this takes time and a lot of trial and error to see it properly.
With the effort and time it takes to parse the free Jira reports, you will still be reacting to problems instead of preventing them.
How Oboard and ActionableAgile® Analytics Connect Strategy to Work
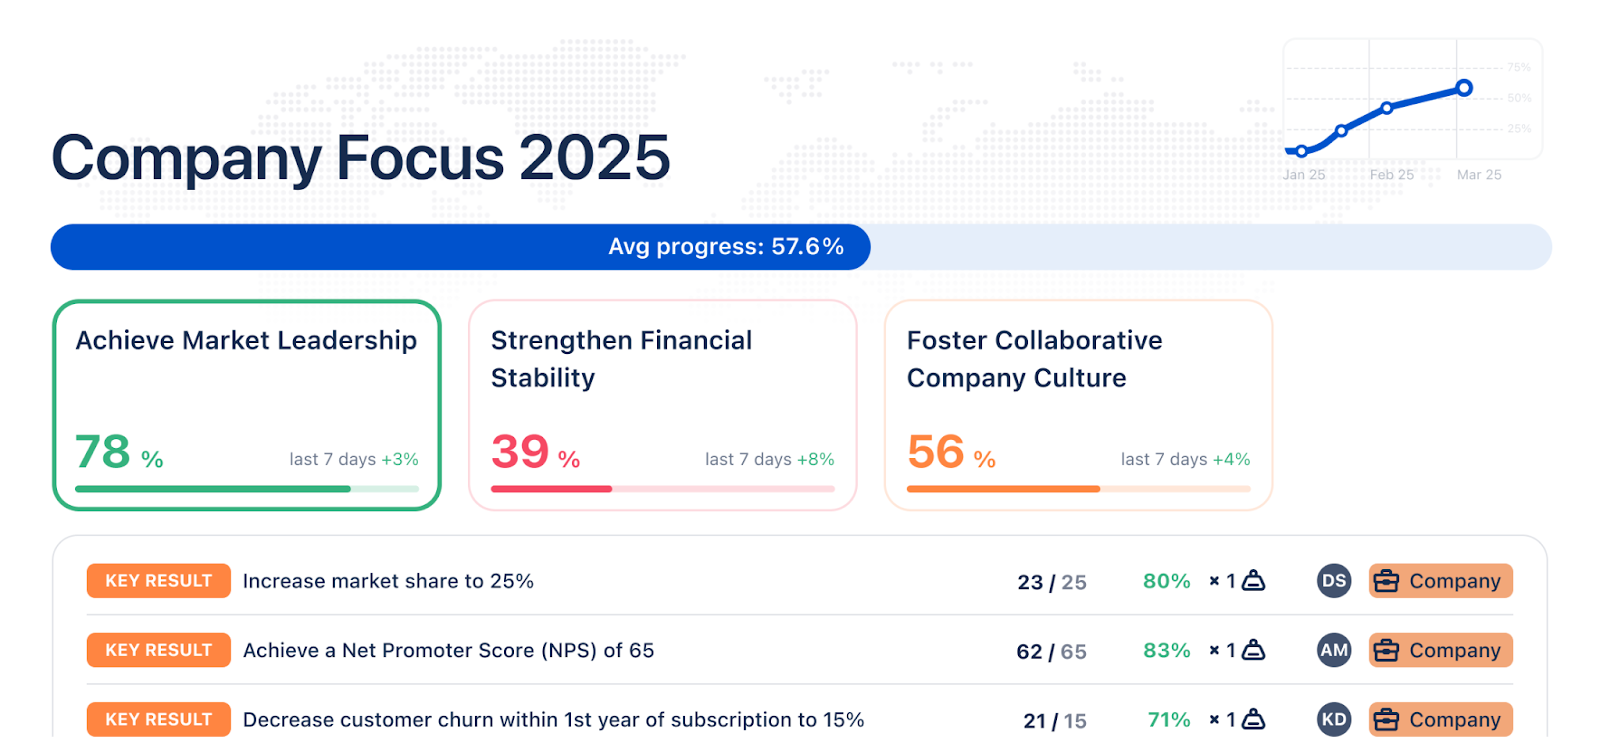
OKR Board for Jira helps teams define and track OKRs within Jira, ensuring clear alignment between strategy and execution. It provides easy-to-use tools for OKR tracking and management, along with customizable, real-time OKR reports
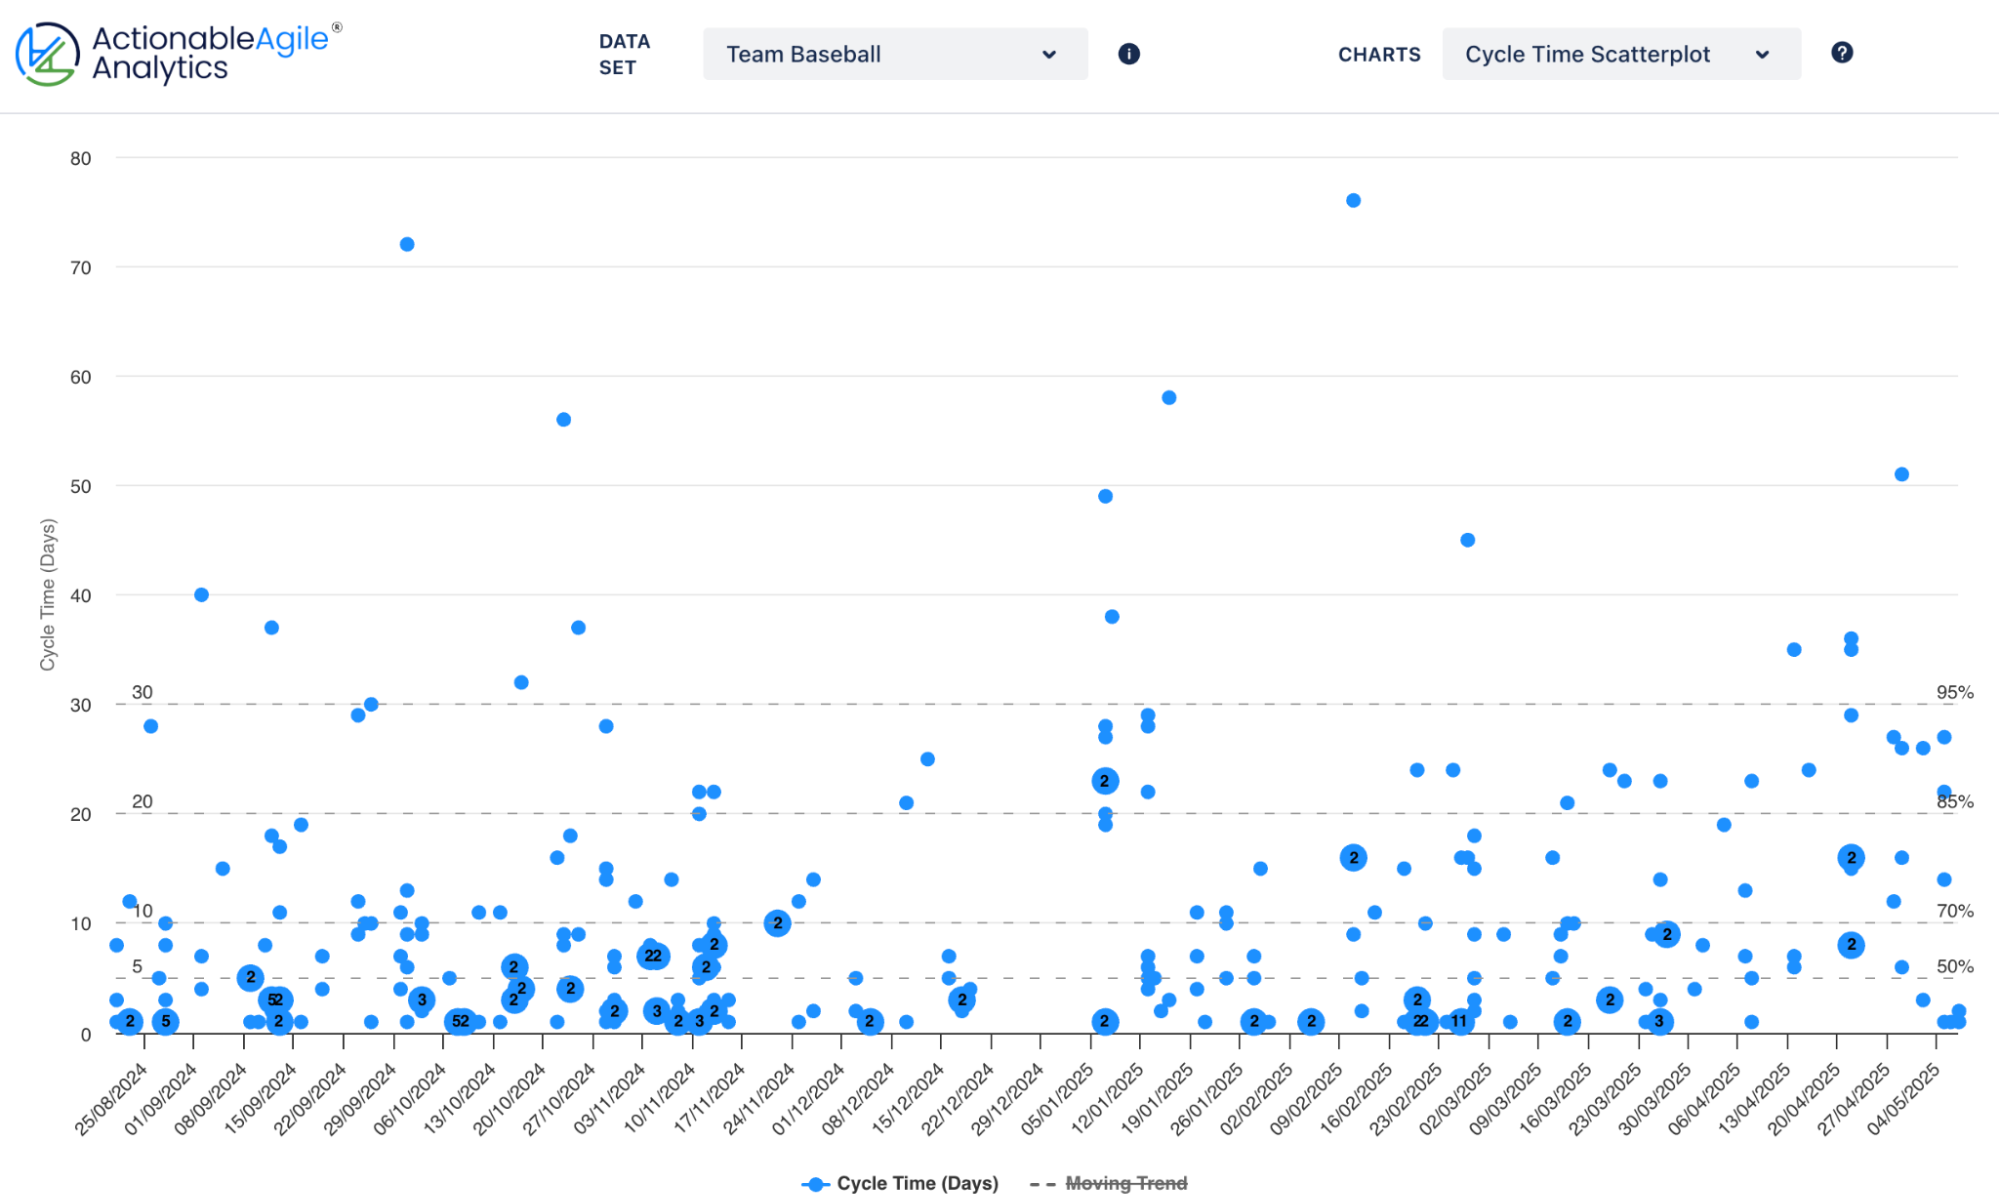
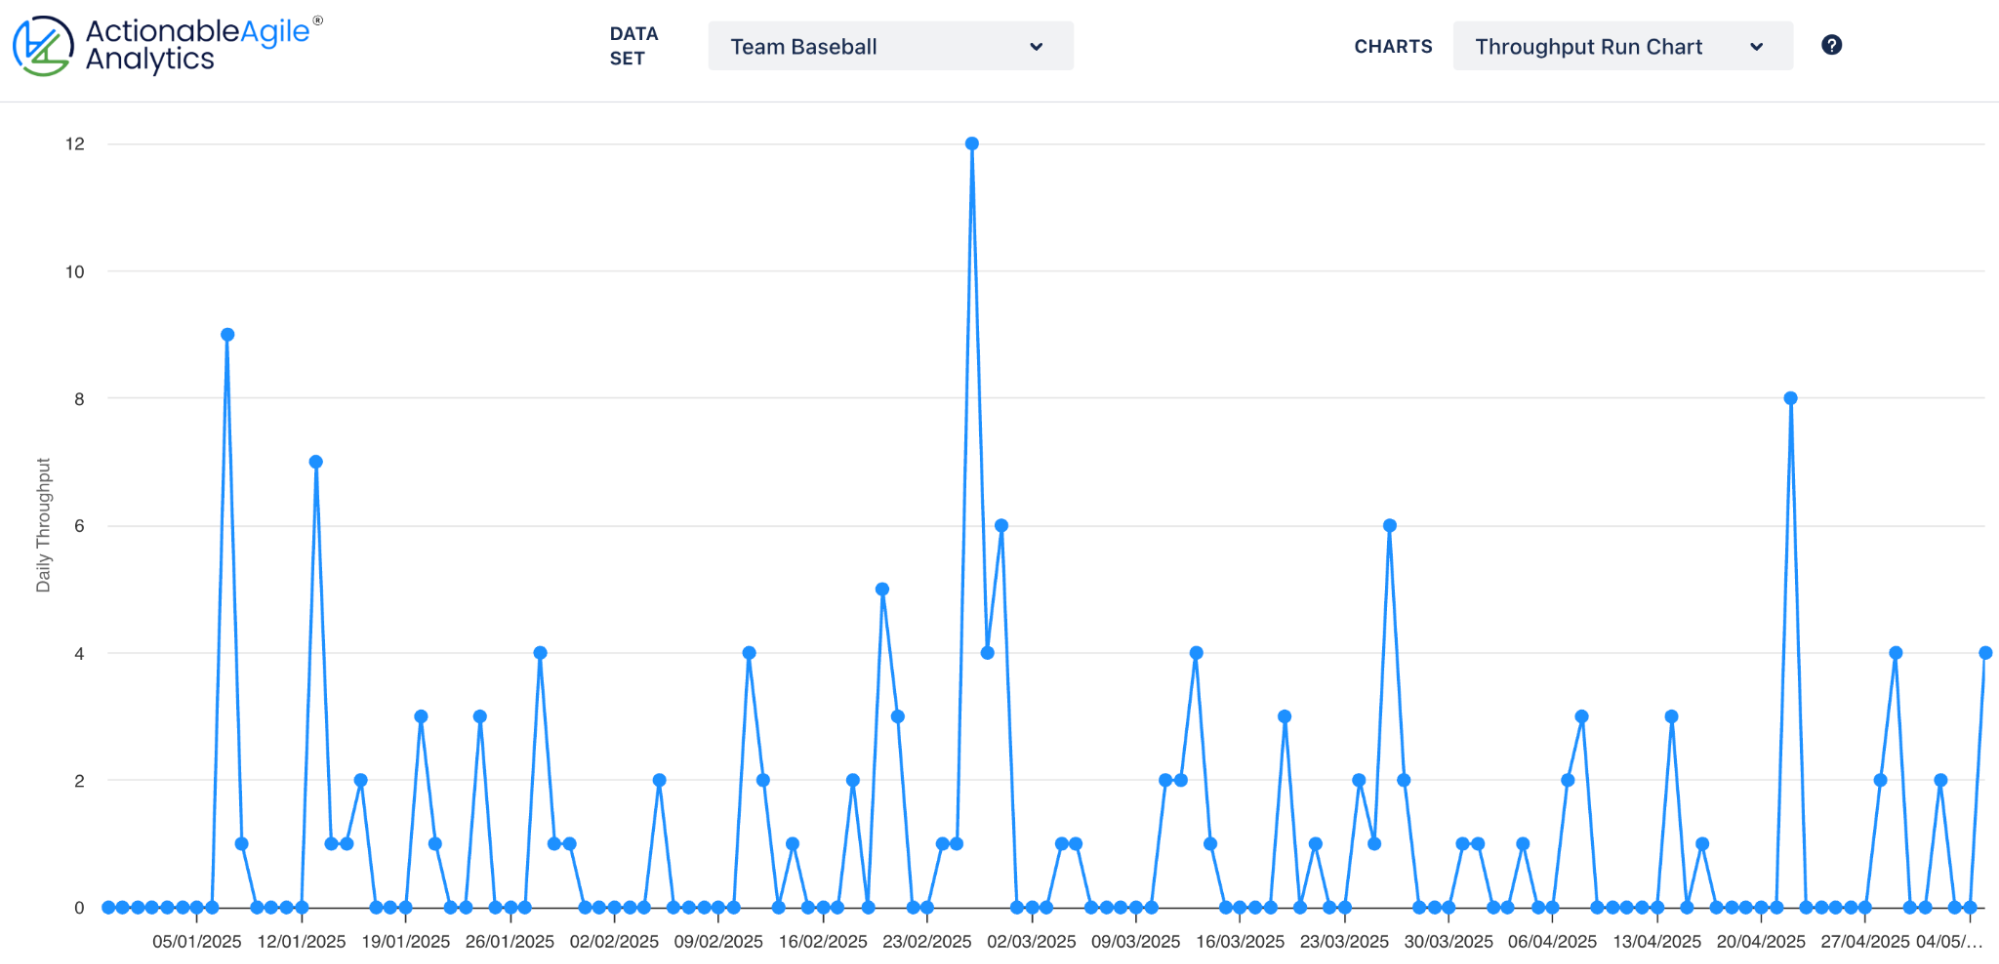
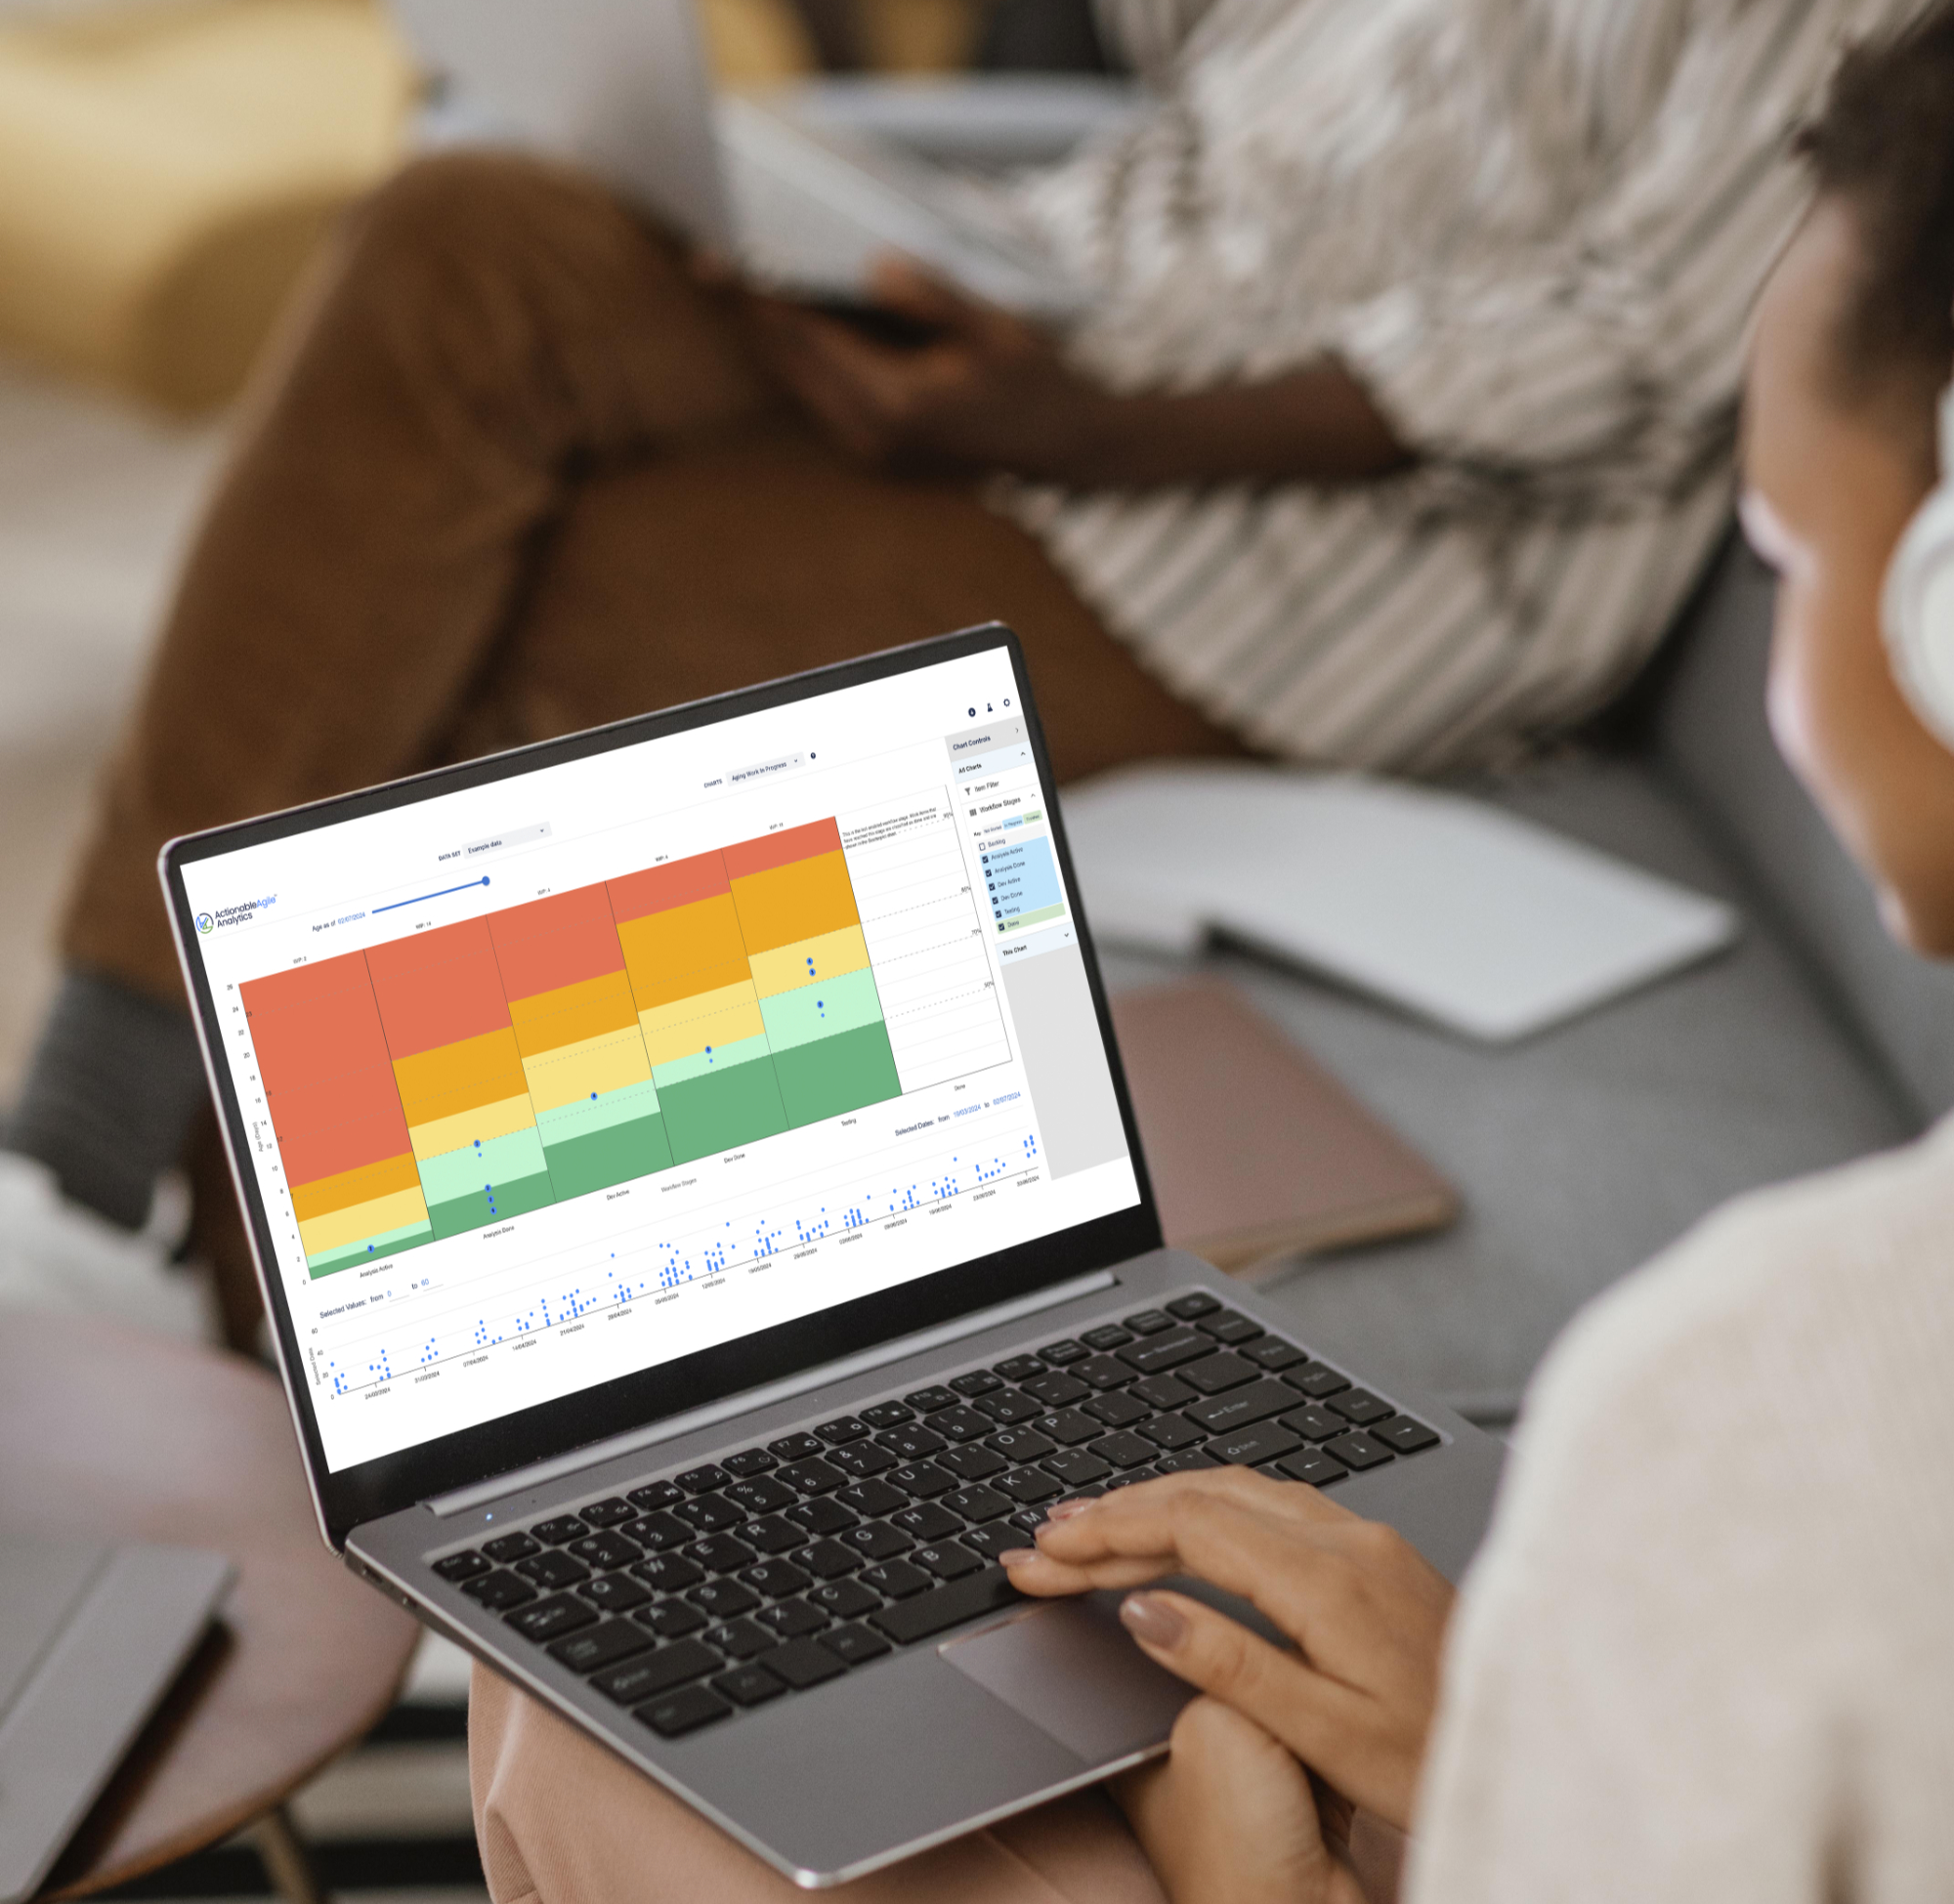
ActionableAgile® Analytics is a powerful flow metrics tool that helps teams track work progress, spot bottlenecks, and improve predictability — all within Jira. With insights into Cycle Time, Throughput, Aging Work in Progress (WIP), and Monte Carlo Simulations, teams can move beyond gut feeling and make data-driven decisions about delivery speed and efficiency.
By using ActionableAgile® alongside Oboard, teams can bridge the gap between strategy (OKRs) and execution (flow metrics), ensuring they don’t just set goals — they achieve them.
Key Flow Metrics That Help Tech Teams Achieve OKRs
Tech teams using Jira often set OKRs around efficiency, speed, and stability. To emphasize those qualities, we recommend you to focus on the flow metrics, such as:
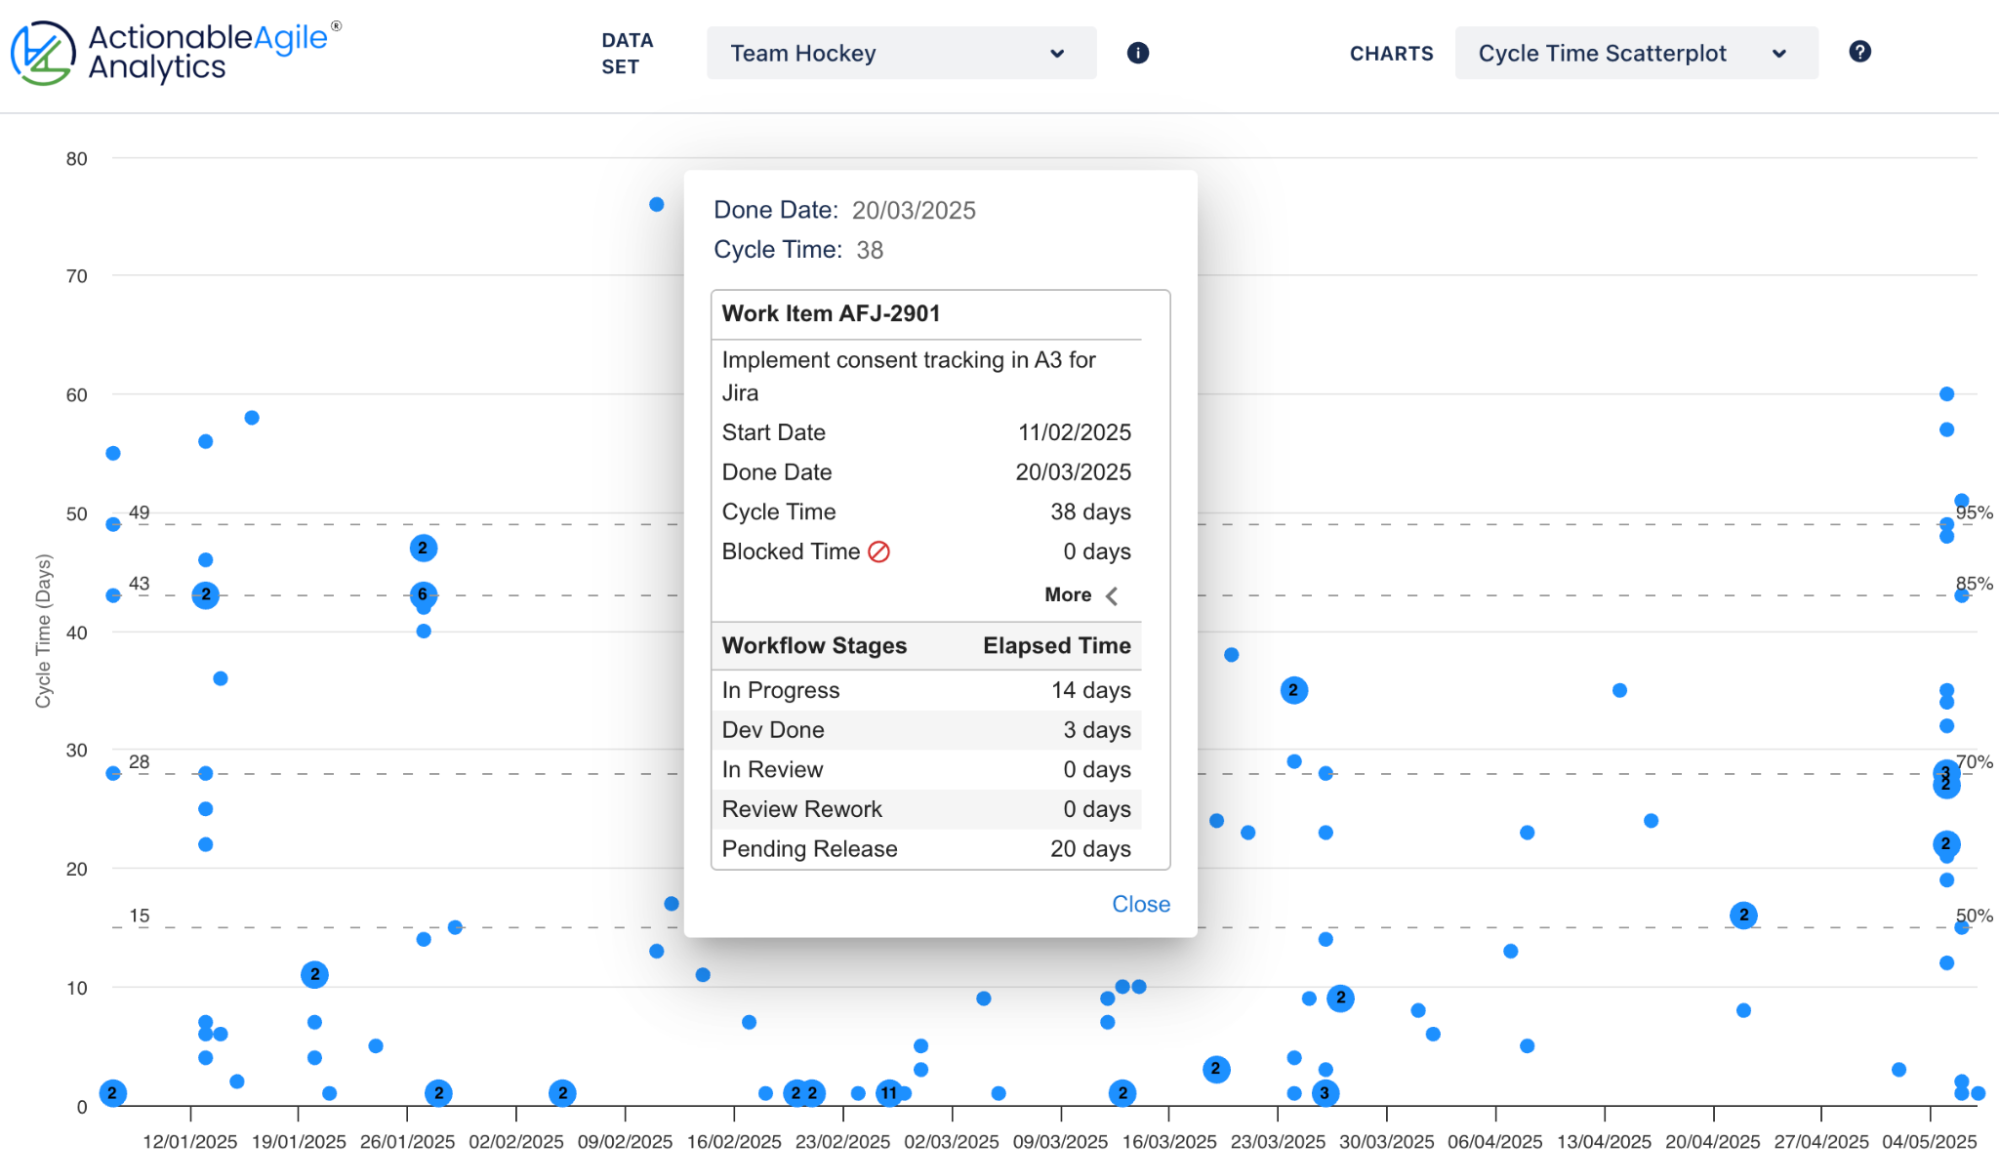
Cycle Time – Tracks how long issues take to move from “In Progress” to “Done,” helping teams identify bottlenecks in Jira workflows and optimize handoffs.
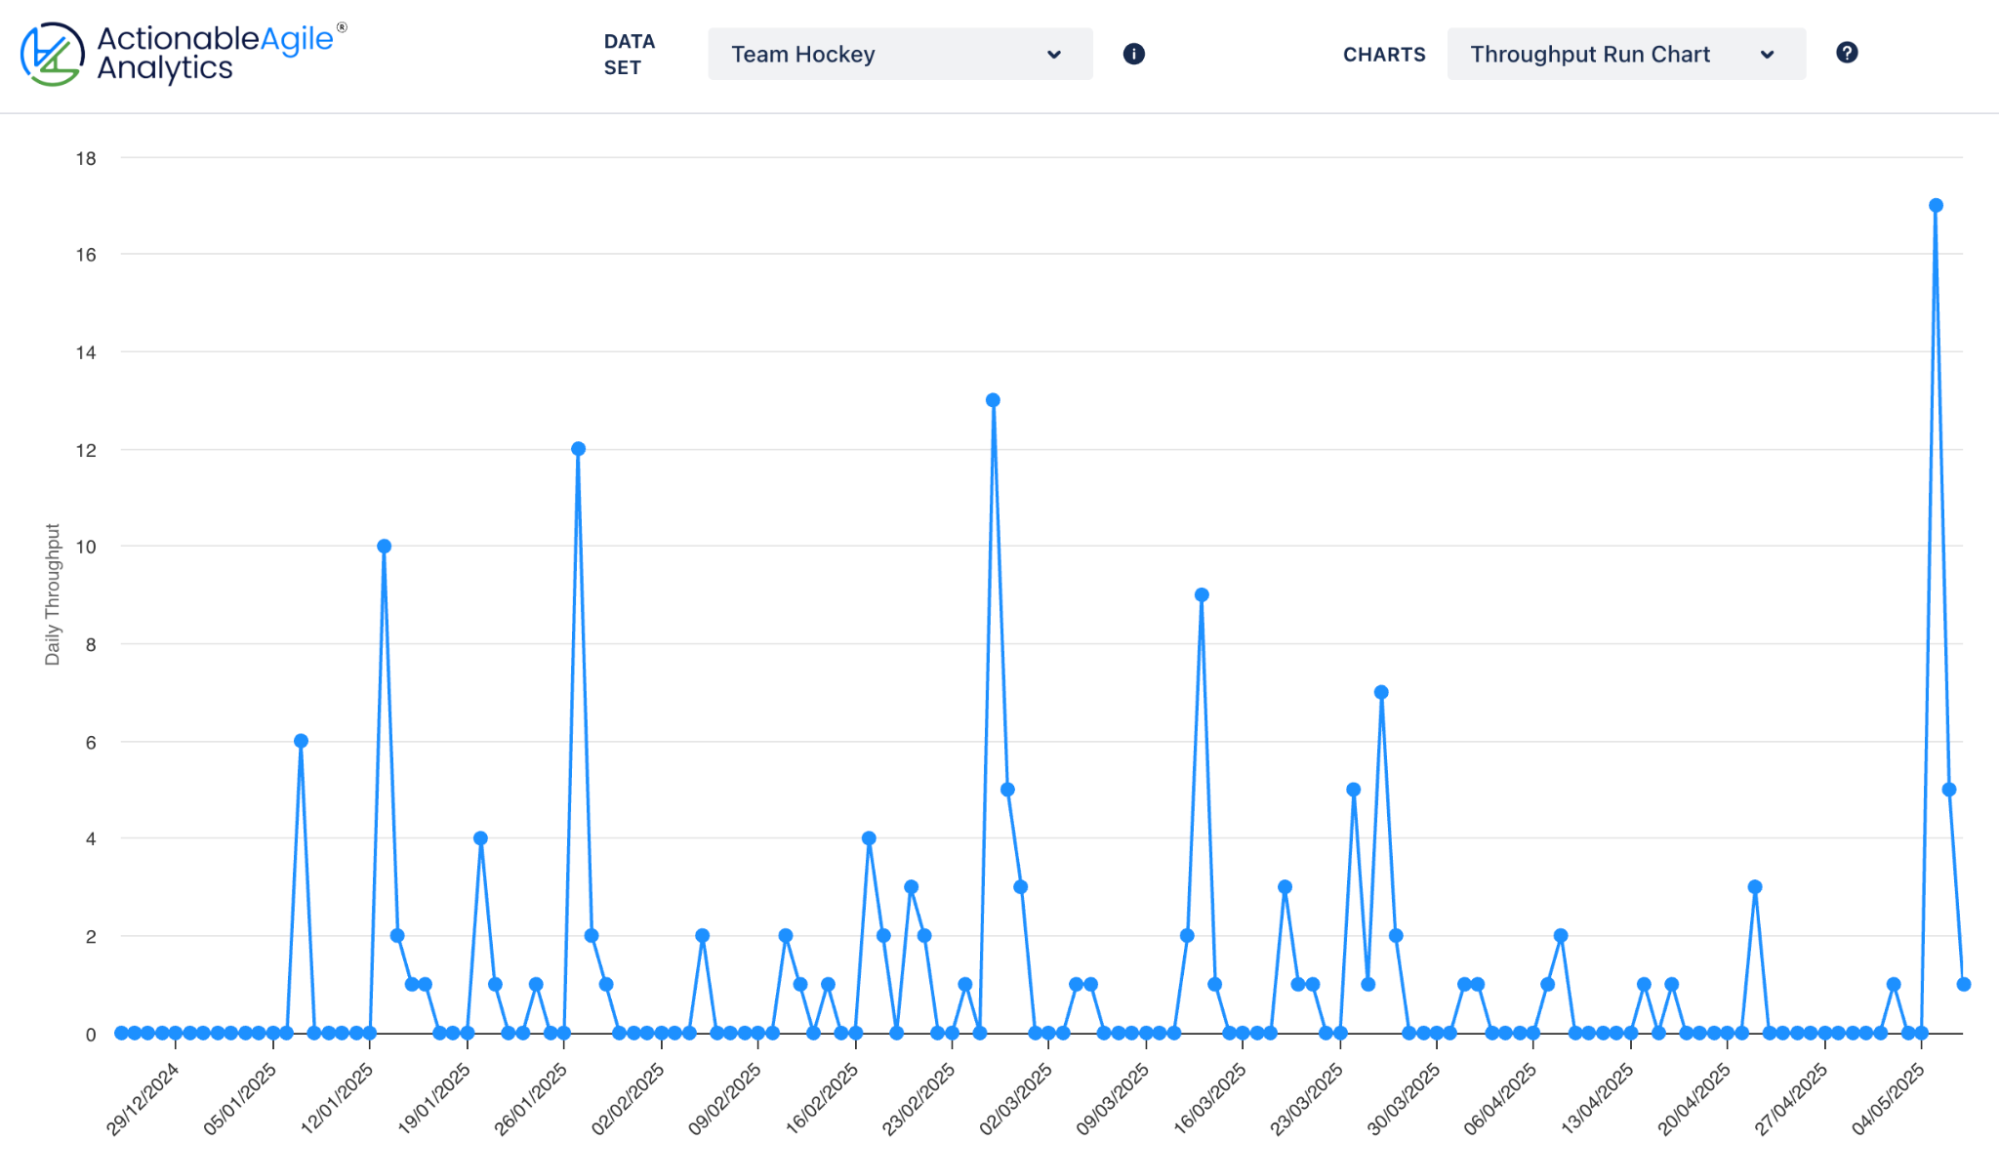
Throughput – Measures completed Jira issues over a set period, ensuring teams can track delivery rates and adjust sprint or release goals accordingly.
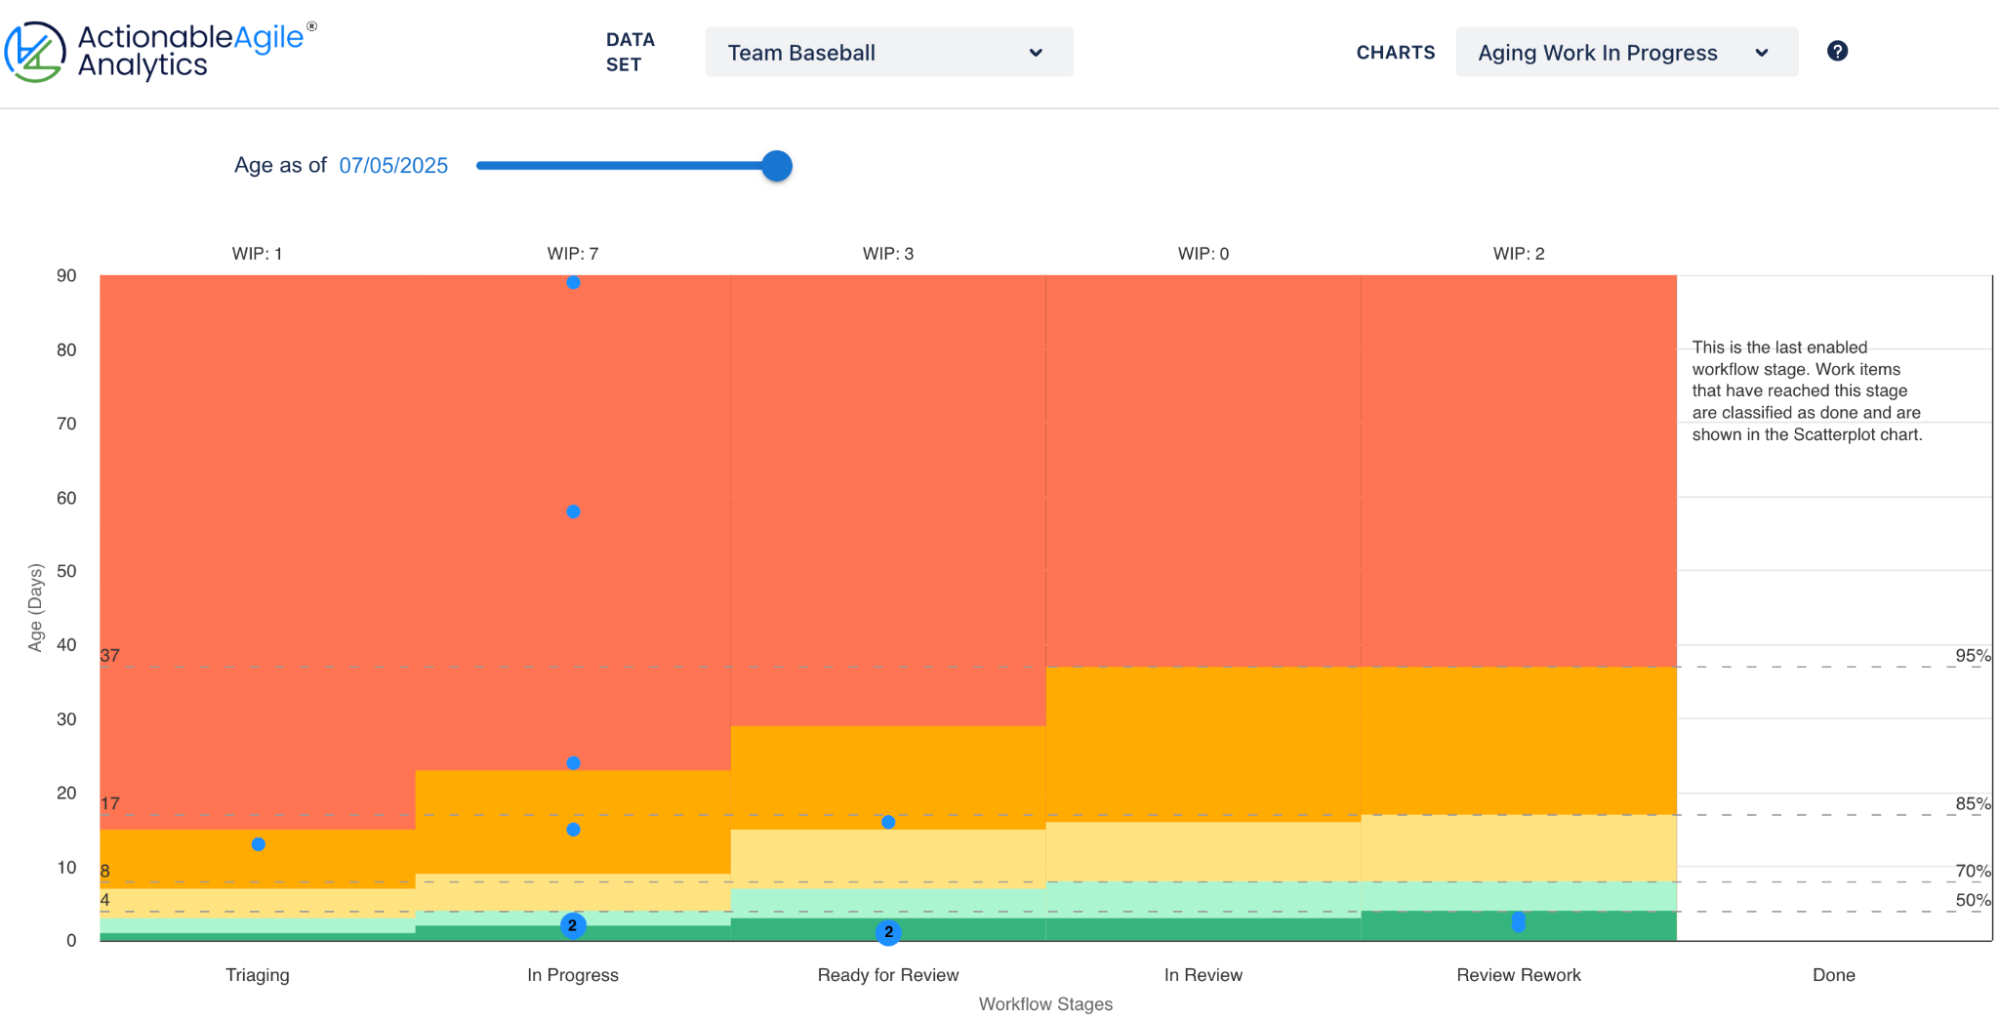
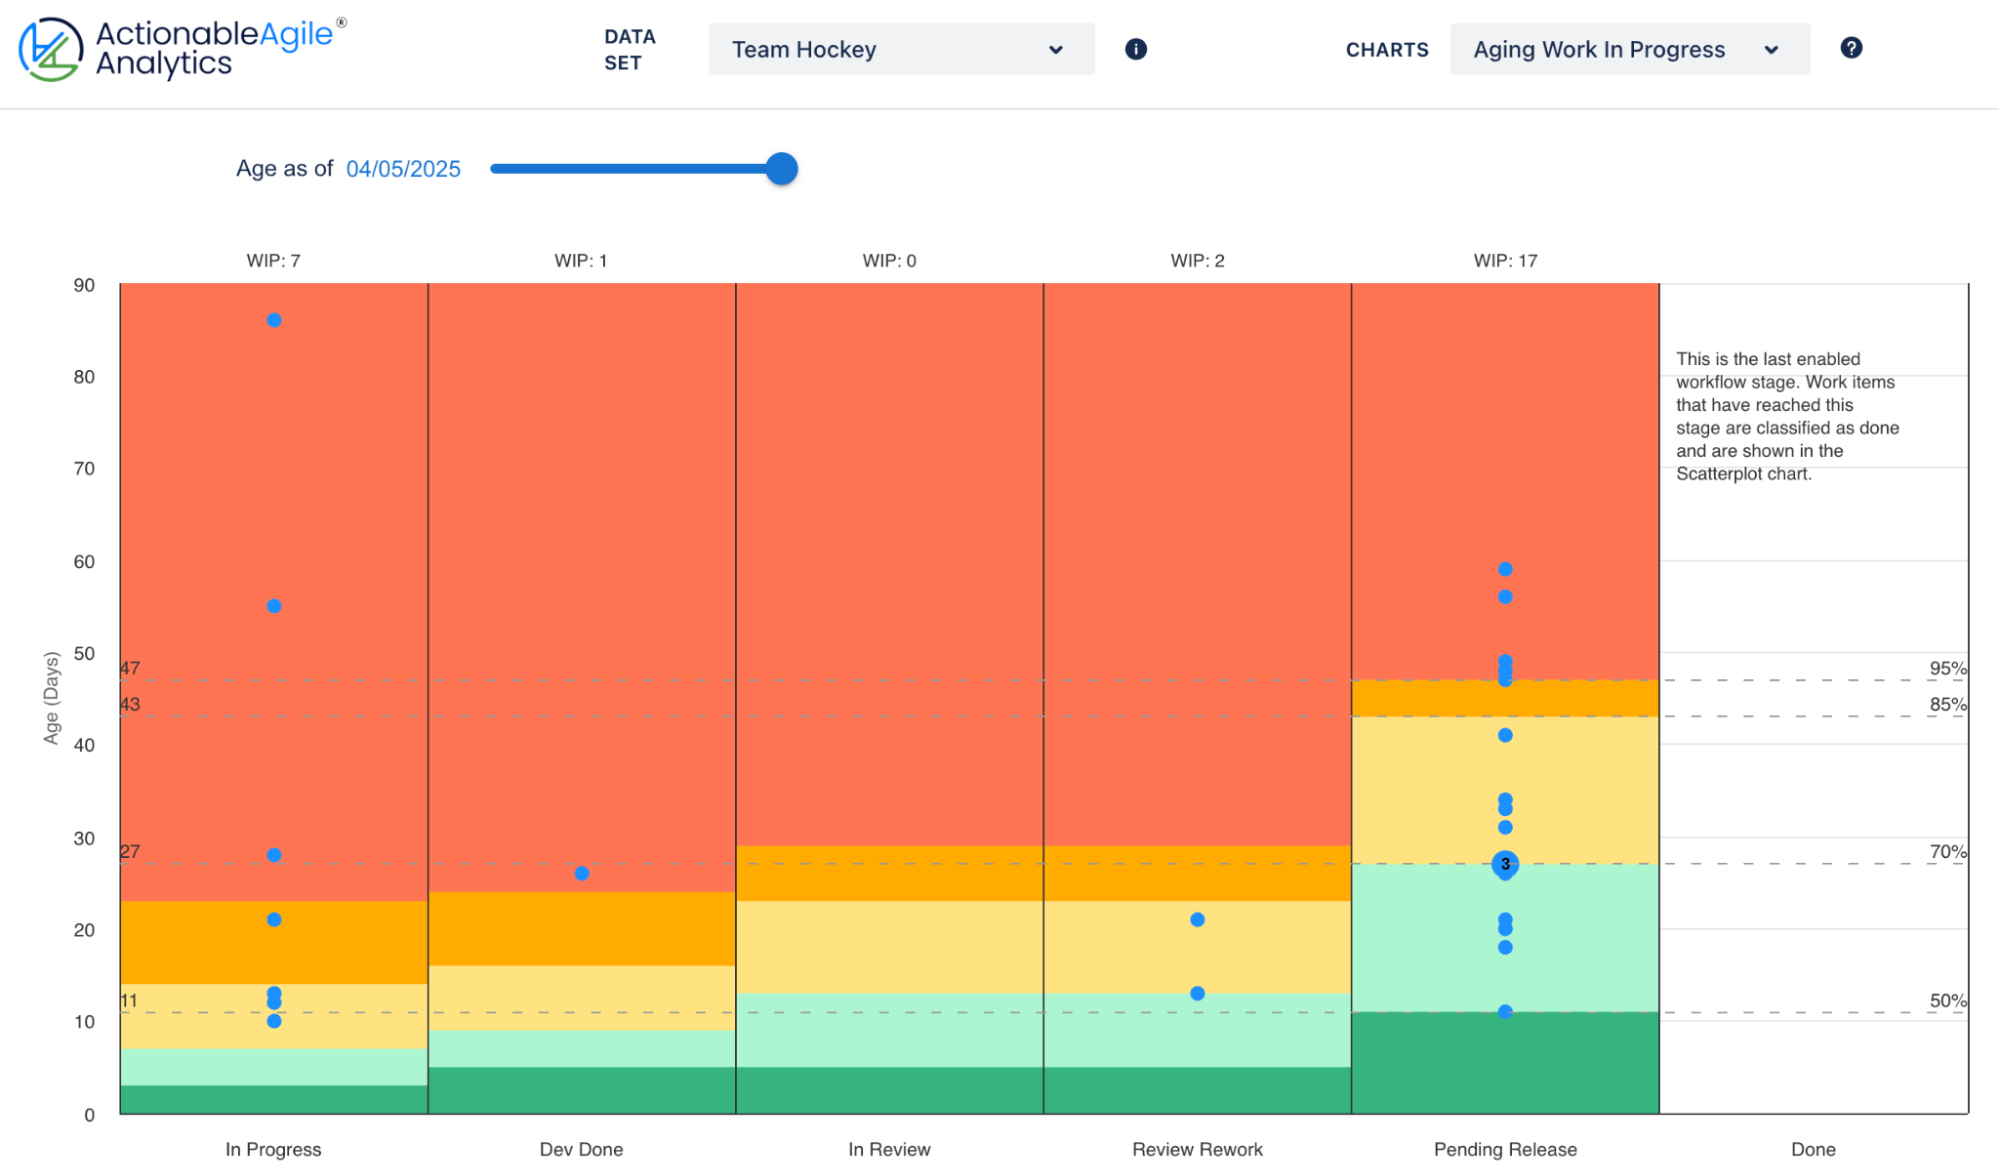
Aging Work in Progress (Aging WIP) – Identifies stalled tasks in Jira boards, highlighting risks before they impact OKRs tied to lead time or efficiency.
(Bonus Tip) Monte Carlo Simulations – Forecasts OKR success by predicting feature delivery dates based on historical Jira data, helping teams set realistic deadlines.
These metrics will provide you with the clarity that Jira alone cannot. For example, if an Engineering team’s OKR is “Reduce deployment lead time by 20%,” flow metrics show where the slowdowns occur. If Aging WIP is high, it signals that tasks are getting stuck. If Cycle Time isn’t improving, teams can identify process bottlenecks and improve efficiency.
Real-World Examples of Flow Metrics for Tech Team OKRs
When it comes to improving how your tech team works, OKRs are just the start — flow metrics reveal why things slow down and where adjustments are needed. Below are real-world examples of how DevOps and Scrum teams use metrics like Cycle Time, Aging WIP, and Throughput to turn objectives into action and challenges into insights.
OKR: Improve Software Stability & Reliability
A DevOps team using Jira has the following OKR:
[O] Improve stability by accelerating issue resolution and reducing system failures.
[KR1] Reduce the number of unresolved critical incidents in Jira by 20%.
[KR2] Decrease mean time to resolution (MTTR) for performance-related issues by 30%.
They can use the following Agile Flow Metrics to see the actual challenges behind it:
Cycle Time for bug and performance fixes measures how long it takes for Jira issues to be resolved from detection to resolution, identifying potential delays.
Throughput of resolved incidents ensures the team completes fixes at a sustainable rate to meet the OKR.
Aging WIP highlights bottlenecks by identifying Jira issues that have been in progress for too long without being completed.
Example in Action
The Engineering team analyzes Cycle Time trends and sees that critical incidents take an average of 20 days to resolve, with 4 days spent in triage before work begins. This insight sparks discussions on reducing triage time and optimizing handoffs, leading to actions that shorten resolution times and help achieve the OKR.
OKR: Improve Deployment Speed & Predictability (Scrum Team Focused)
A Scrum team working in Jira set the following OKR:
[O] Improve delivery speed and predictability;
[KR1] Increase the number of completed and deployed features per sprint by 25%;
[KR2] Ensure 90% of committed backlog items are delivered within the sprint.
To uncover what’s slowing them down, they rely on these Agile Flow Metrics:
Cycle Time for feature development indicates where delays occur throughout the sprint workflow.
Throughput of completed stories tracks how consistently the team delivers value.
Monte Carlo Simulations forecast sprint completion likelihood and help manage delivery expectations.
Example in Action
The team notices that P1 bugs often fail to meet SLA deadlines. A closer look at Cycle Time reveals that these bugs remain in the “Pending Release” state for up to 20+ days. That insight triggers improvements in prioritization, Jira automations for fast-tracking critical bugs, and a new escalation process. The result? Faster resolutions, happier customers, and an OKR achieved.
Conclusion
Setting OKRs is the easy part. Making them happen? That’s where most teams struggle. Oboard provides the structure to align strategy within Jira. ActionableAgile shows you how work is flowing — or not. Used together, they help teams stop guessing, start seeing, and take action where it matters.
Because hitting your goals shouldn’t be about scrambling at the end of the quarter — it should be about knowing, early and often, whether you’re on track.
Curious what that looks like in practice? Try combining Oboard and ActionableAgile®—and start closing the gap between ambition and delivery.
About Oboard
https://oboard.io/ is an Atlassian Marketplace app that helps teams set, track, and achieve OKRs directly in Jira. By connecting strategic goals to daily work, Oboard provides the structure teams need to stay aligned and focused on what matters most.
This post was created in close collaboration with Margo Sakova, Marketing Manager at Oboard.