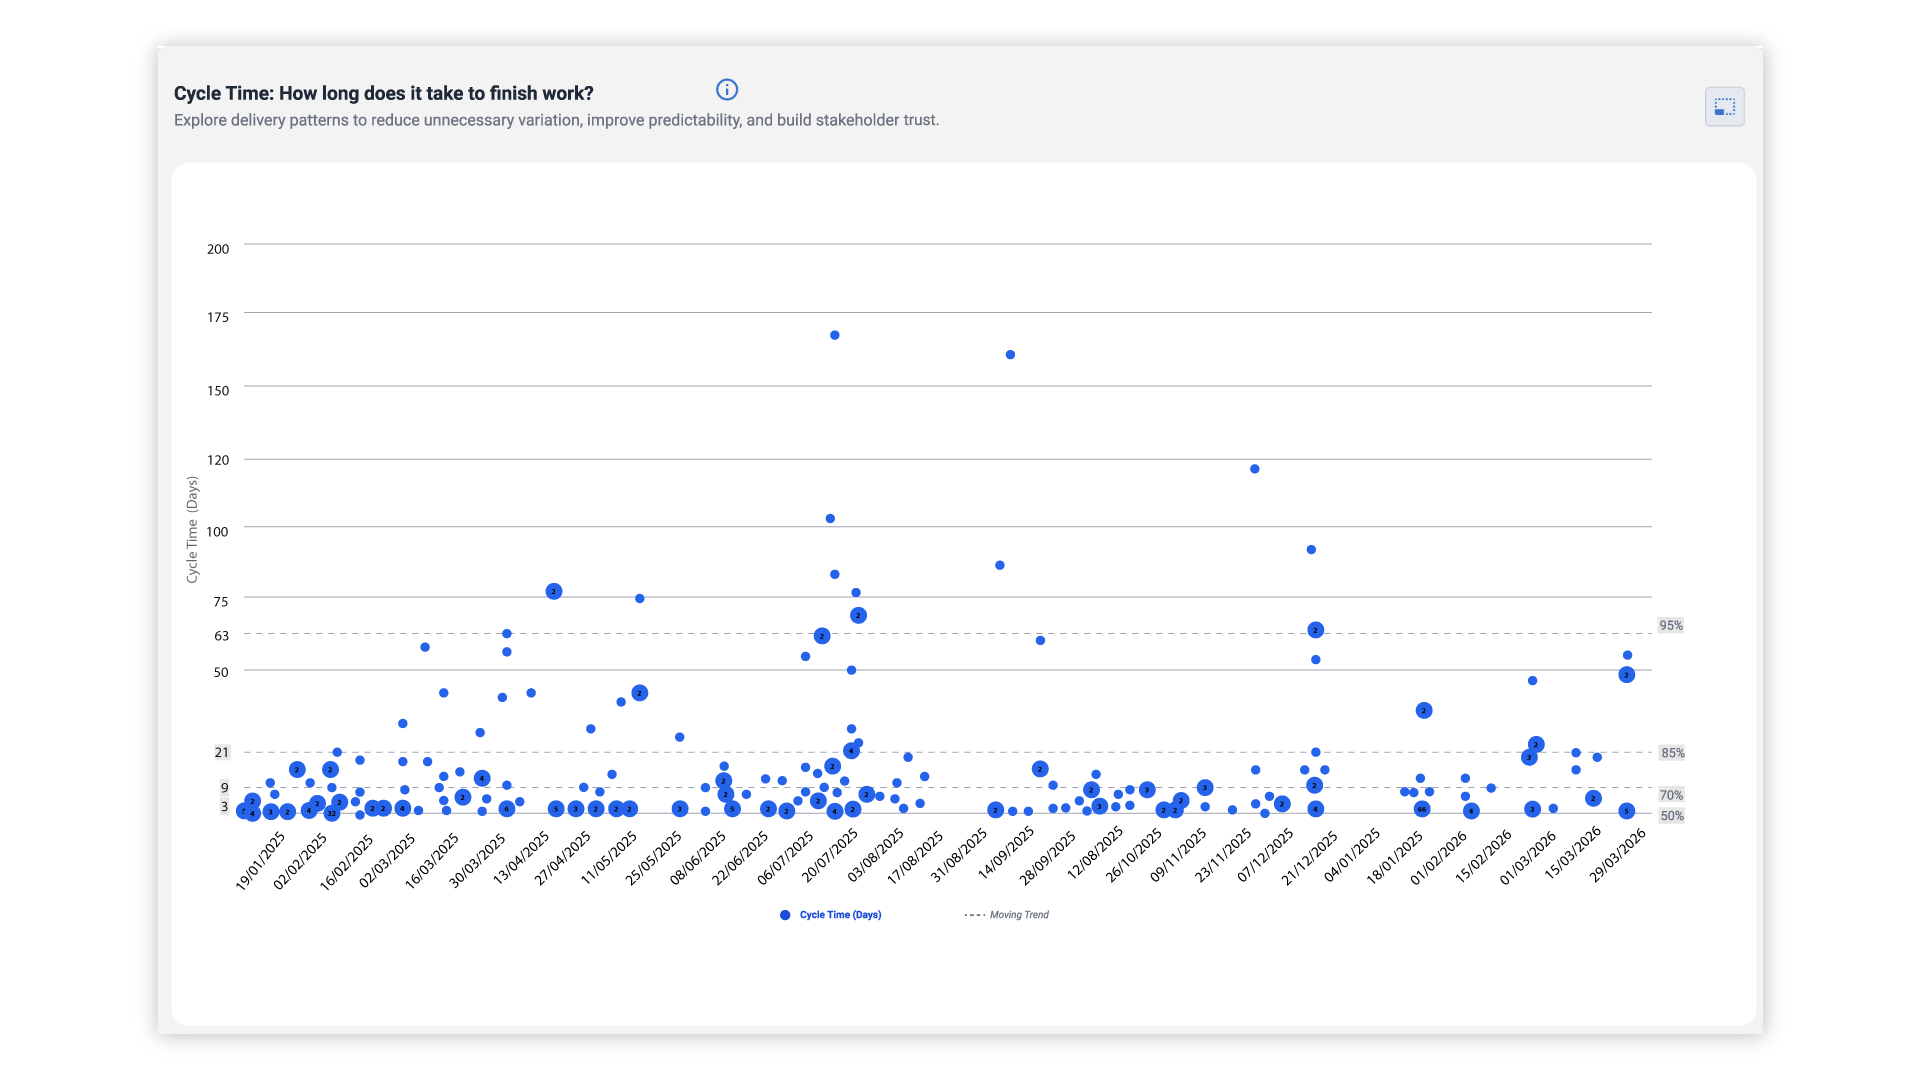

Flow metrics are measures of how work moves through a delivery process: work in progress, cycle time, throughput and work item age. Used together, they show where work is delayed and, from historical data, how likely a team is to finish by a given date, so forecasts rest on evidence rather than estimates.
What are flow metrics?
Flow metrics describe how work moves from the moment a team starts an item to the moment it is done. Four measures cover most of what a delivery team needs:
-
Work in progress (WIP): The number of items that have been started but not finished. Read more about WIP.
-
Cycle time: The elapsed time an item takes from start to finish. Read more about cycle time.
-
Throughput: The number of items finished in a period, such as a week. Read more about throughput.
-
Work item age: how long an item that is still in progress has been in progress. Read more about work item age.
Because these measures are calculated from the history of your work items, they describe what actually happened rather than what was planned.
You may also come across the Flow Framework, a separate model with its own terms such as flow time and flow velocity. This guide uses the four measures above. They come from Kanban practice, and they can be calculated directly from the data in tools such as Jira and Azure DevOps.
Cycle time vs lead time
Cycle time and lead time are often mixed up. Cycle time starts when the team begins work on an item. Lead time starts earlier, when the request is made, so it also includes the time an item waits in the backlog.
Both are useful. Lead time shows what the customer experiences, and cycle time shows how your process performs once work has started. Whichever you use, define the start and the end clearly and keep them the same over time, otherwise the numbers cannot be compared.
How to read the charts
Four charts turn the metrics into something a team can discuss together.
-
Cycle time scatterplot. Each dot is a finished item, placed by the day it finished and the time it took. Percentile lines show how long items usually take, for example "85% of items finish in nine days or less" (an illustration, not a benchmark). Read more about the scatterplot.
-
Aging work in progress. This chart shows the items currently in progress and how old each one is. An item that is already older than most finished items is worth a conversation before it finishes late.
-
Throughput run chart. Items finished per week, which shows how steady delivery is.
-
Cumulative flow diagram. The number of items in each stage over time. A band that keeps widening means work is piling up in that stage, which is often the first sign of a bottleneck.
These charts show where work gathers or ages. They do not explain why, but they give the team a place to start investigating with data instead of opinion.
From flow metrics to a forecast
"When will it be done?" is the question every delivery lead is asked.
Flow metrics help answer it because throughput records how many items a team has actually finished in each period.
Monte Carlo simulation uses that history. It draws from past weeks of throughput at random and plays the future forward thousands of times. The result is not a single date but a range with likelihoods, for example "70% likely by 3 March and 85% likely by 17 March" (illustrative numbers).
A forecast like this is a probability, not a promise. It tells stakeholders how confident the team can be and lets them choose how much risk to accept. It also assumes that the near future resembles the recent past, so it should be run again when the team or the work changes.
Teams that estimate with story points can keep doing so. Throughput-based forecasts simply do not depend on them. To go further, read about Monte Carlo simulations and forecasting, probabilistic forecasting and probabilistic vs deterministic forecasting.
Getting started in Jira
You do not need to change how your team works to start measuring. The history is already in your tool.
-
Define start and finish. Decide which statuses in your workflow mean that work has started and which mean that it is done.
-
Check the data. Items that skip statuses or are closed in bulk distort cycle time. Look for them before you trust the charts.
-
Start with one team. Look at the four metrics for a single team and ask what surprises them.
-
Use the charts in meetings you already hold, such as the weekly review or the retrospective.
ActionableAgile® Analytics reads this history from Jira and shows the charts and forecasts without spreadsheets. It is available for Jira and for Azure DevOps Services.
Example: Faster delivery at Sanofi
Sanofi used ActionableAgile® Analytics for Jira Cloud and shifted the teams' focus from velocity to cycle time, work item age and throughput. According to Sanofi's published case study, time to production fell from about three months to 12 days.
At Spektrix, one team's cycle time at the 85% confidence level dropped from 16–18 days to 6–8 days in less than three months, as described in their case study.
Results depend on how teams use the data. Both stories describe changes in how work was managed, not just a new tool.
FAQ
What are the four flow metrics?
Work in progress, cycle time, throughput and work item age.
What is the difference between cycle time and lead time?
Cycle time is measured from when work starts. Lead time is measured from when the work was requested.
Do I need story points to forecast delivery?
No. A throughput-based forecast counts finished items. Teams that use story points can keep using them alongside flow metrics.
Where does the data come from?
From the history of your work items in a tool such as Jira or Azure DevOps. No manual tracking is needed.
Next steps
See your own flow metrics: Try ActionableAgile® with your own data (primary button), or book a demo to see how it works for your teams.