This customer story was originally published on March 19, 2021.

We asked Ben Parry, Partner & Integration Delivery Lead at John Lewis, about his mission to reduce integration delivery lead time by 25% and how the improved metrics and reporting from ActionableAgile Analytics help make that possible. Here’s what he had to say!
ActionableAgile Analytics connects my team more to outcomes and helps us to respond to trends over time. Outside my team, it’s now possible to have a common language around charts and metrics. The scope for cross-team learning is increasing.
What was going on in your business that made you look for flow metrics and then eventually purchase ActionableAgile Analytics?
The last five years have seen rapid growth in both our food and GM websites. Do more with less! Be disruptive! Be efficient! This push brought a focus on flow, and many people have been introduced to ActionableAgile Analytics to visualize it. I became involved as I was aware of the opportunity to act on insight from data in non-digital contexts.
I believed that waiting time could be reduced/eliminated on one of the strategic projects that I was involved with.
I wondered if planning could be driven more by data; one big project was reissuing plans every six weeks - was there a lighter-weight way to forecast delivery?
I’d taken customer feedback that a ‘consistent sense of urgency’ would be appreciated - there seemed to be months in refinement but days for build.
Soon after, I started a Lean Six Sigma Green Belt project to see if I could improve my team’s delivery. There were suspicions we were slow; could we become more efficient? To track progress over time, I invested time in getting the most from ActionableAgile Analytics.
What did success look like for you at that time?
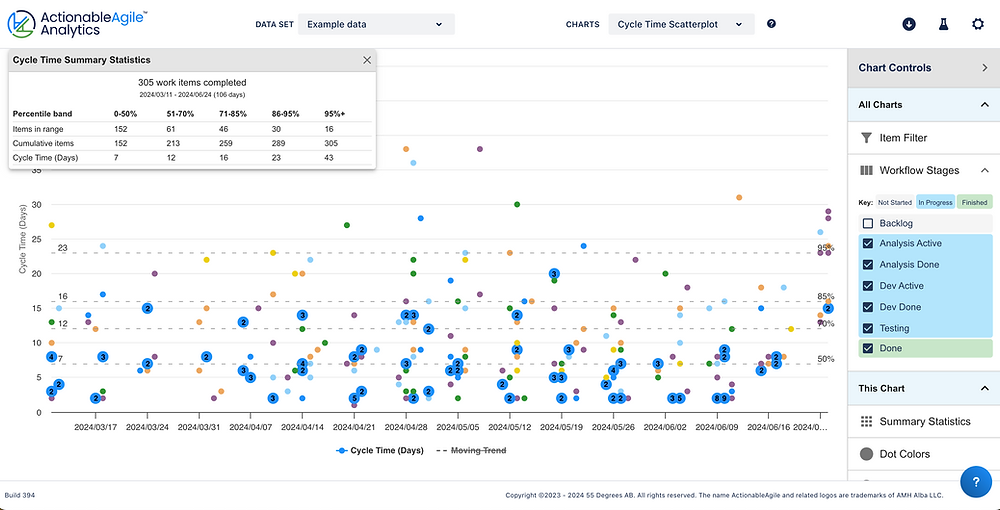
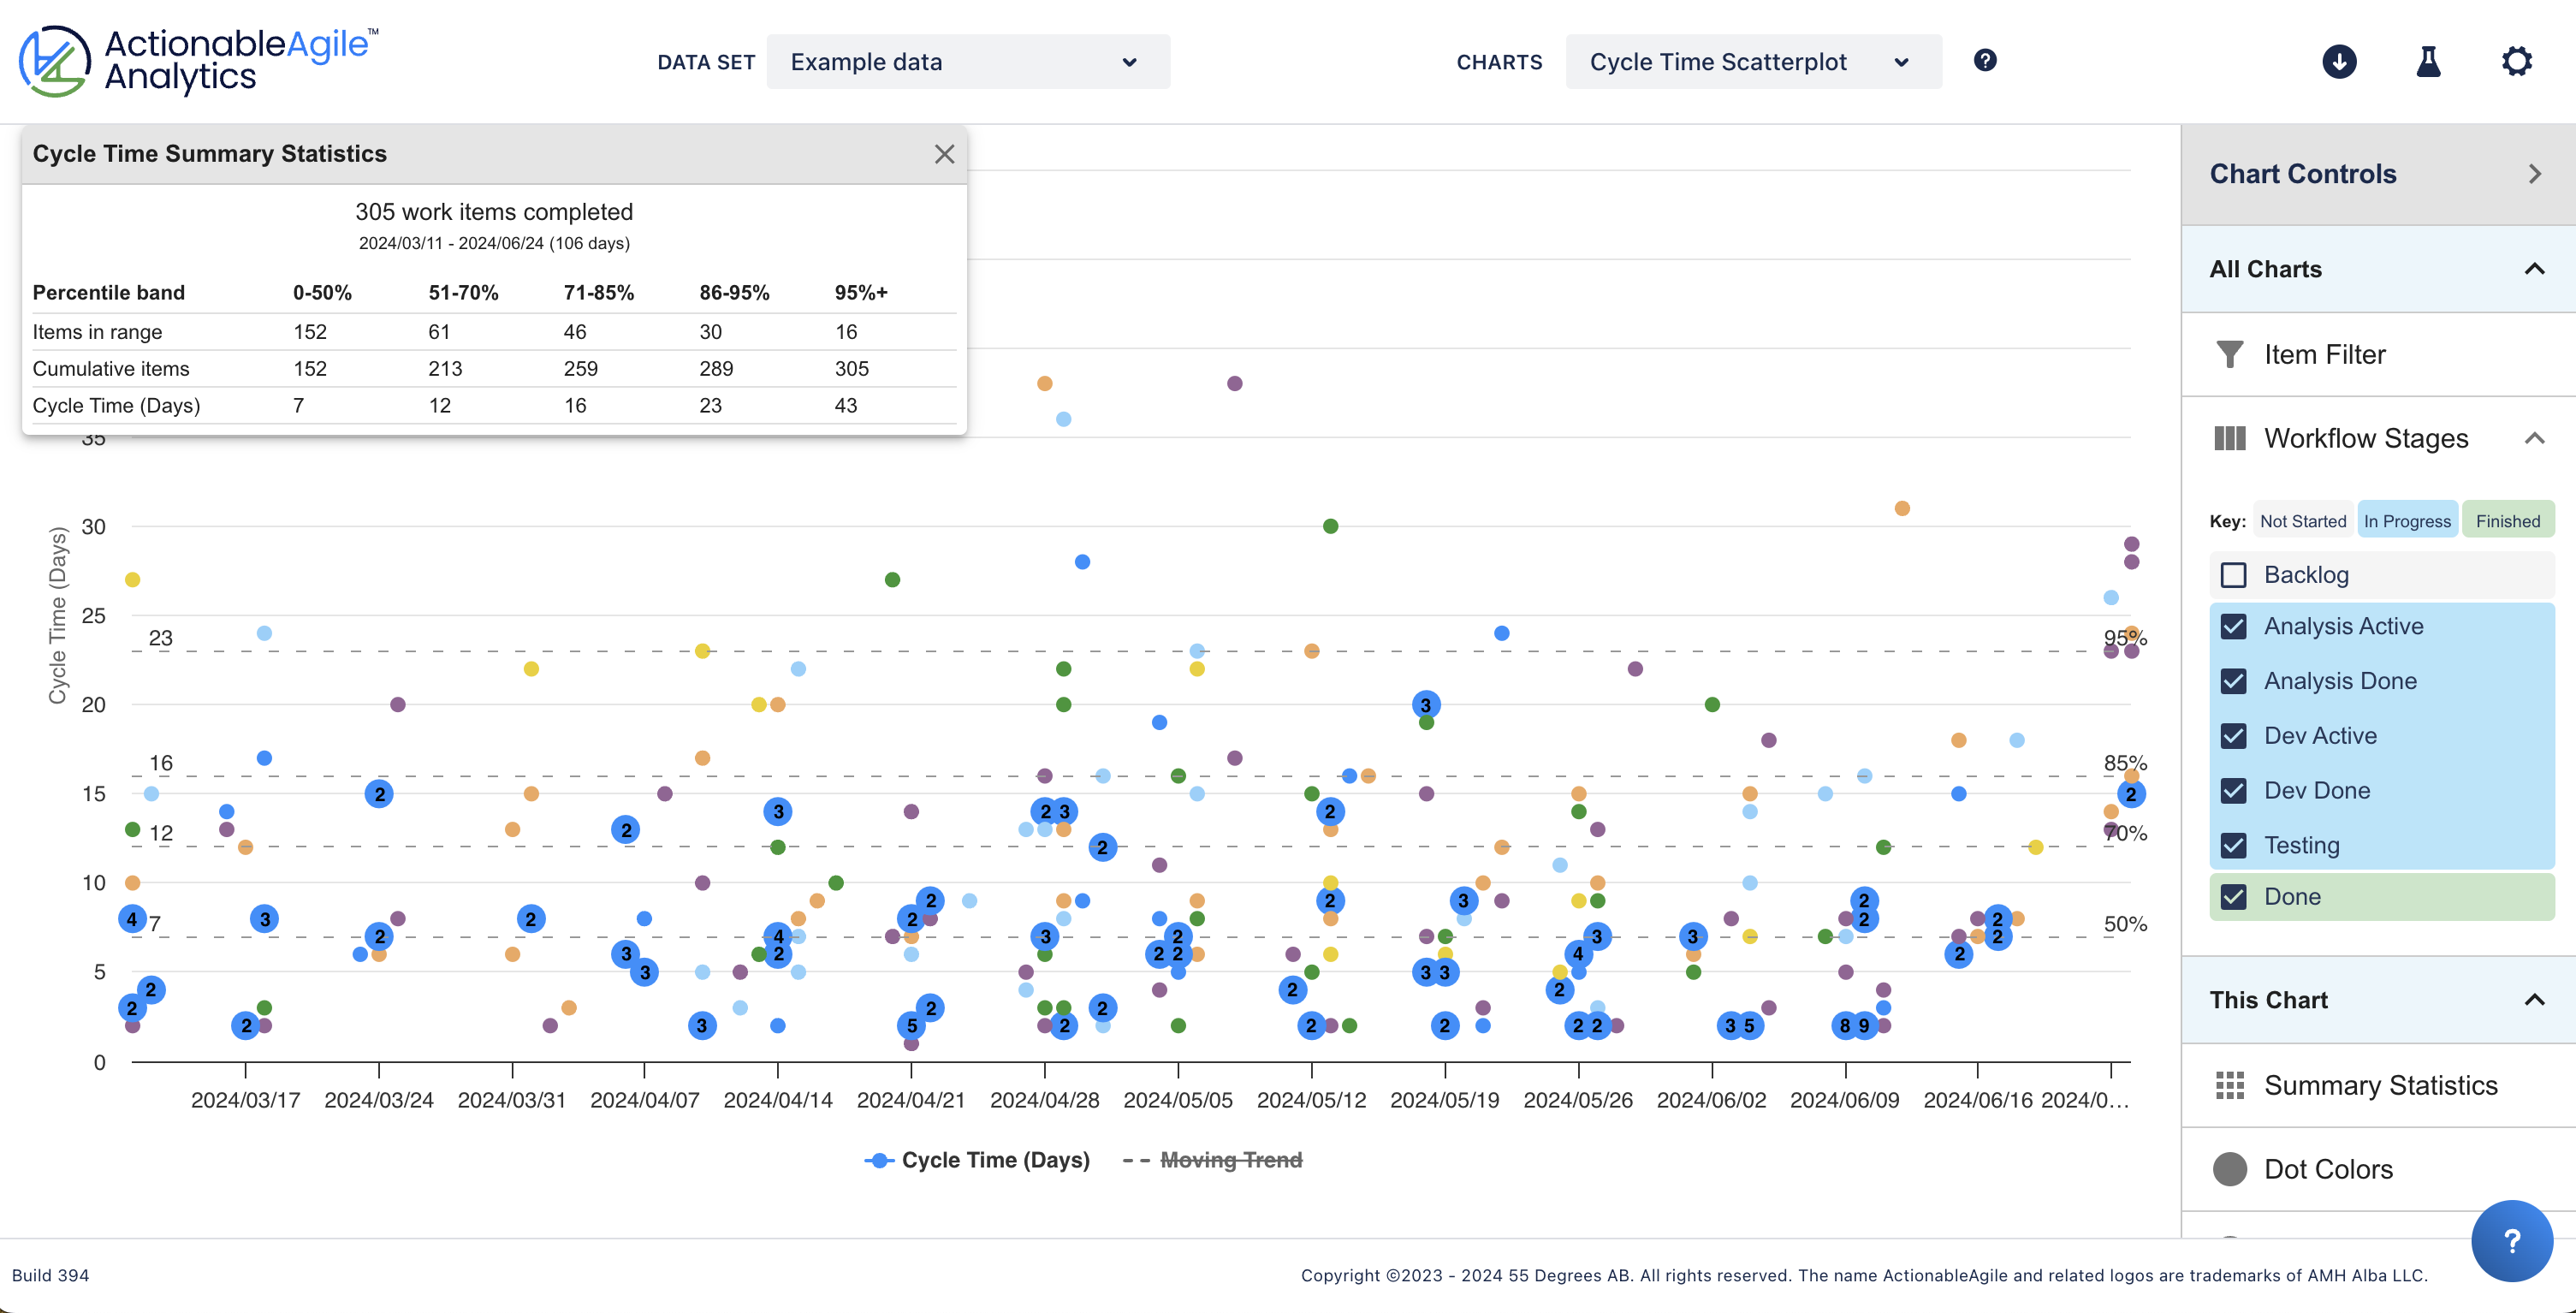
Success was making waste visible and having better conversations on how to reduce them. We needed to work out which wastes were worth tackling first. I used ActionableAgile Analytics and SigmaXL to look at trends in queuing and activity cycle times.
The initial goal was to concentrate on a key metric and increase awareness of that within my team. This was lead time - a customer outcome, not an activity output. The second was to communicate this upwards to my sponsor, which helped me complete my Green Belt Project.
How has ActionableAgile helped to achieve that success?
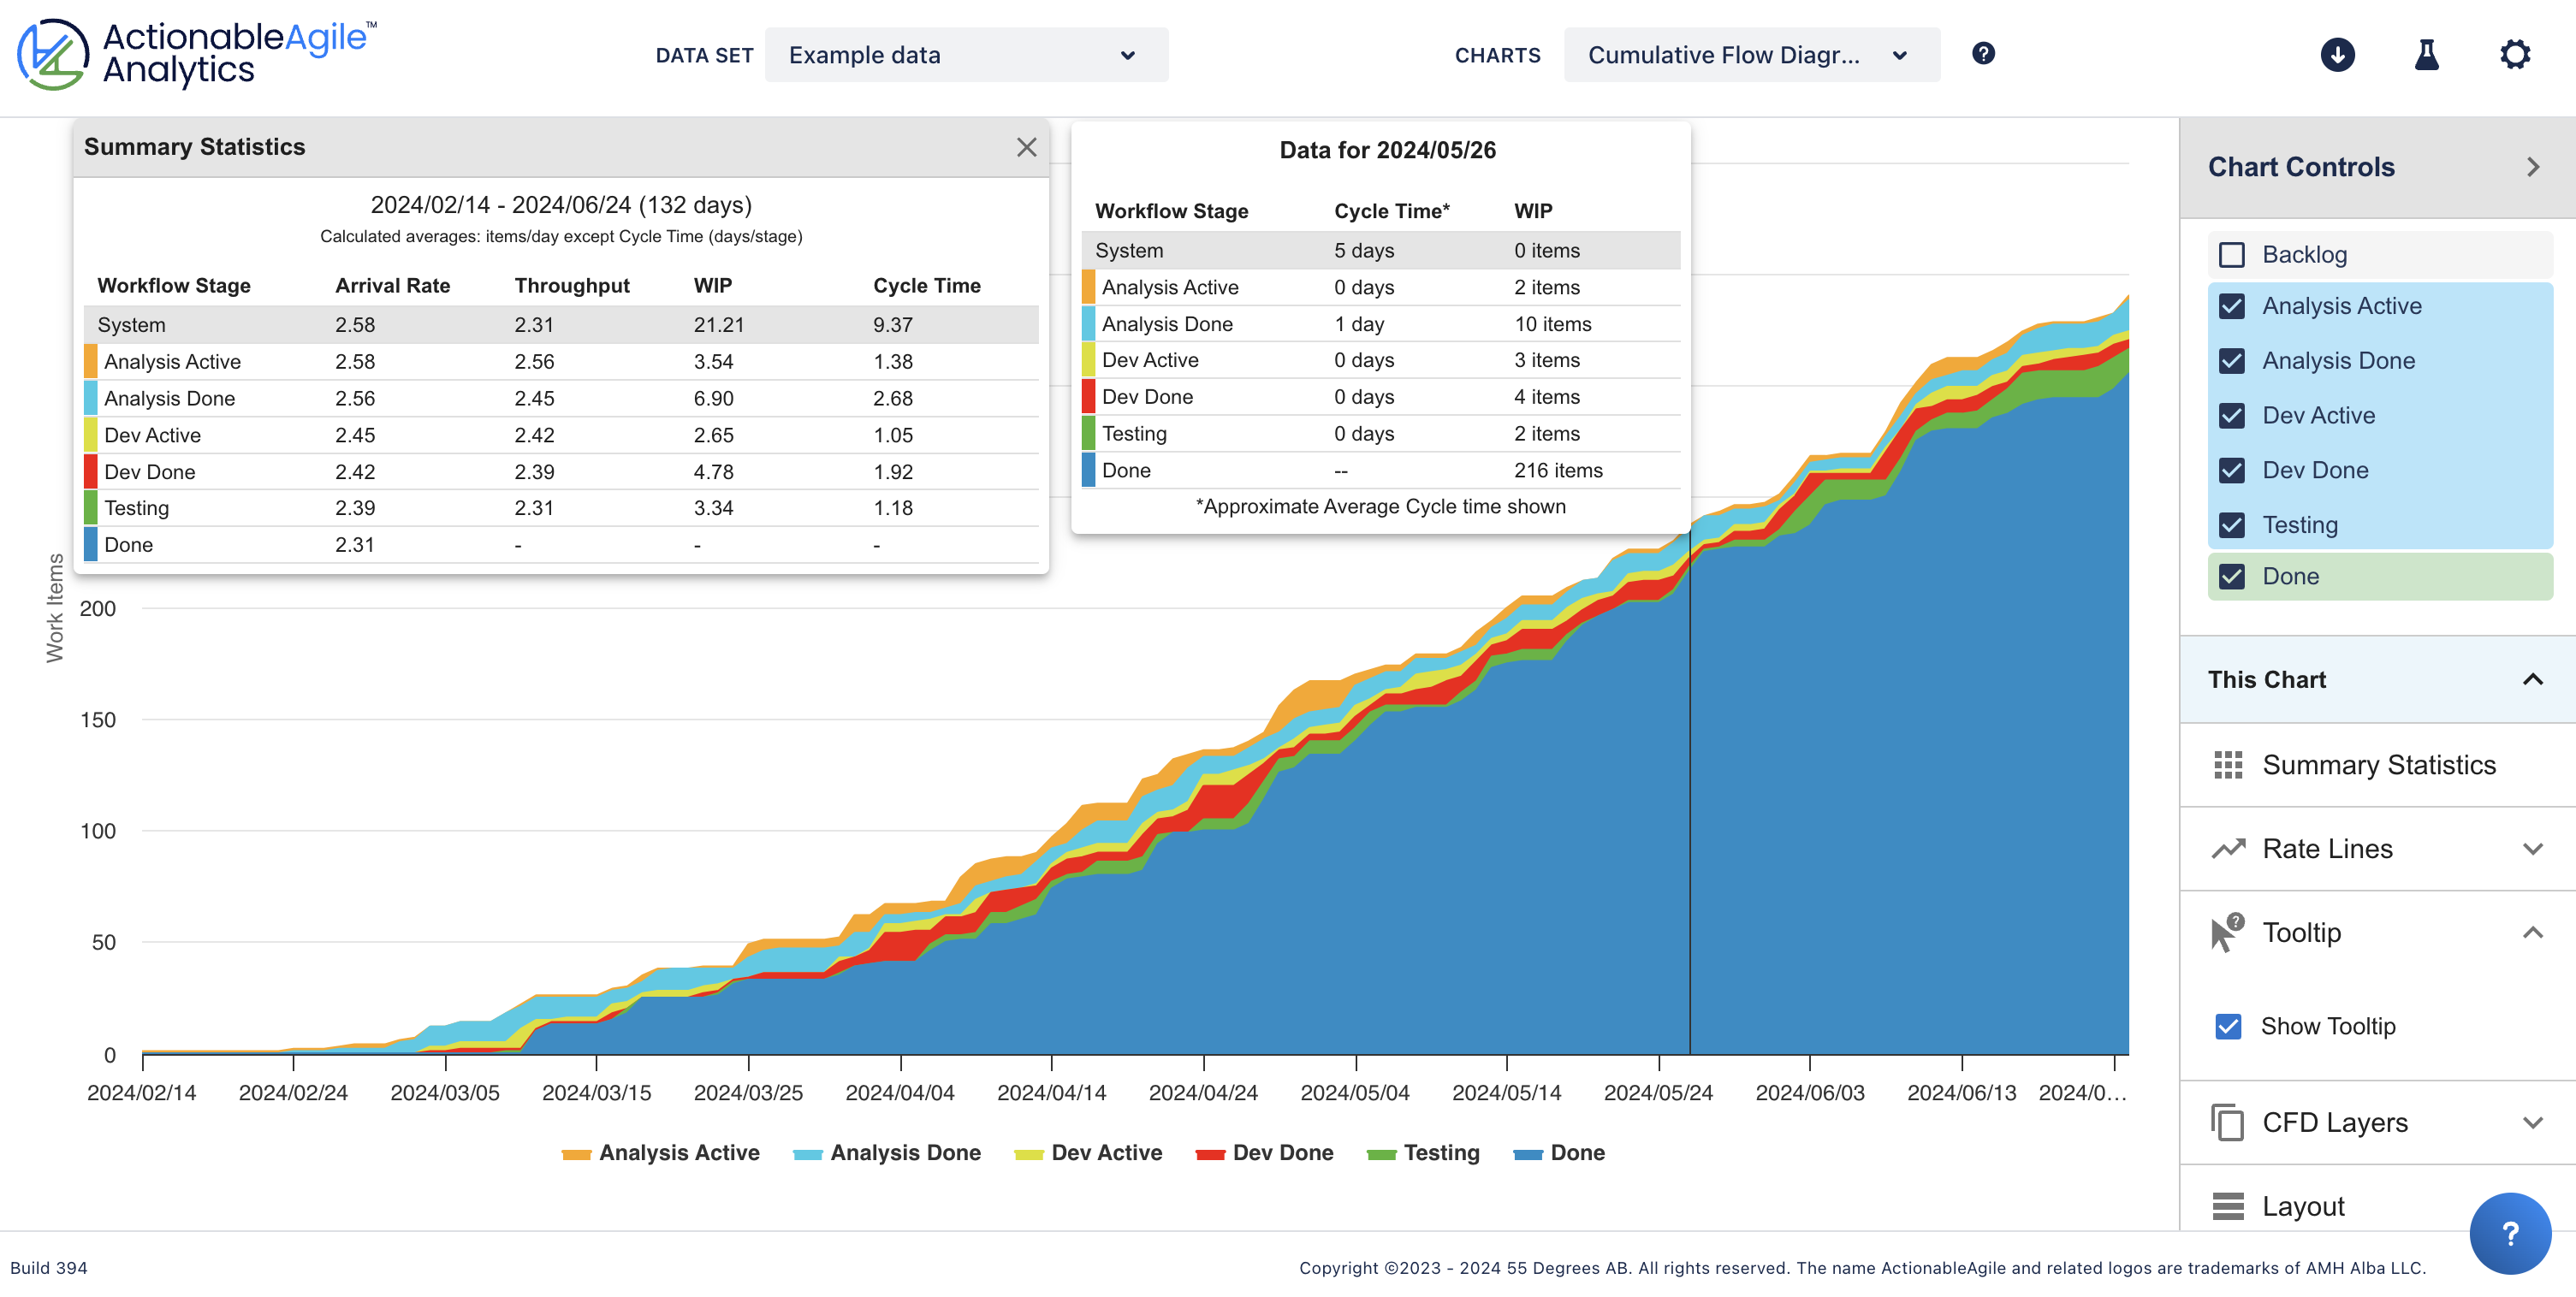
My approach has definitely evolved over time. I’m having better conversations about aging work. I intervene on the top ten oldest tickets or the oldest in a status. Last year, I could also justify recruitment decisions based on the arrival and departure rates on Cumulative Flow Diagrams (CFDs).
Which features or benefits do you like best about ActionableAgile Analytics?
Speed. The time between loading a board from JIRA and inspecting the related CFD is less than 5 minutes. There is no data refinement required - data is simply pulled from JIRA. I like zooming into a CFD and hiding statuses, etc. - something I can’t do with the native Jira CFD. ActionableAgile Analytics is great for detective work!
What was the most valuable thing using ActionableAgile Analytics has brought, and why?
My team is now more connected to outcomes (lead time to deliver value to system test) and our delivery trends over time. Outside my team, it’s now possible to have a common language around charts and metrics. The scope for cross-team learning is increasing.
What results (qualitative or quantitative) have you seen because of using ActionableAgile Analytics?
I’ve inspected how the digital agile teams manage flow and conducted an experiment to see what I could make of their data blindfolded. In doing that, I developed a repeatable process where I could build a report to look at WIP, lead time, throughput, and age in 90 minutes and then playback to the team in 30 mins. Reception to this has been positive, and I’ve had good conversations understanding why my perception of work through data may differ from the reality on the ground. E.g., a dip in throughput - “Yes, that’s where we lost a developer!”
I champion the use of flow metrics and ActionableAgile Analytics as lead of our Flow Optimisation Community (>100 members).

What’s next in your journey?
I’m keen to look at flow beyond and within individual teams, perhaps tracking Epics across teams. At the organisation level, I’ve also been consulted on both:
whether we have the right mix of work (Feature v Compliance work) as well as
how to get a consistent way to train on metrics so Partners can ‘self-serve’.
The worsening economy makes the hunt for waste increasingly urgent. It’s great to have the insight from ActionableAgile Analytics in my back pocket.