
When you hear Monte Carlo you probably have thoughts of the Formula One Grand Prix and extravagant casinos. At 55 Degrees, when we talk about Monte Carlo Simulations we are talking about forecasting. 🤓
What is a Monte Carlo Simulation?
Here's a great definition from Investopedia
Monte Carlo simulations are used to model the probability of different outcomes in a process that cannot easily be predicted due to the intervention of random variables. It is a technique used to understand the impact of risk and uncertainty in prediction and forecasting models. ( Investopedia)
Monte Carlo simulations are widely used in many industries whenever uncertainty exists. Investment firms use them to project potential earnings across different investment options. Insurance companies use them to forecast risk in different populations or areas. Companies like yours can use them to forecast when you'll finish a group of work!
Simulations help make sense of uncertainty
Rarely can you give someone a forecast and be absolutely, positively certain that you'll be right. There are just too many uncontrollable factors that can get in the way.
When we are uncertain about something, one way to learn more is to run experiments. Are you unsure how likely it is that a flipped coin will land on heads? To find out, you can flipping it over many times and use the results to calculate the likelihood. Do you need to know how long it will take to complete a specific work item? You can use your past cycle times and calculate how long it's likely to take.
Do you need to know when you'll finish a group of work instead of a single item? That's a bit more complex! Instead of manually doing groups of work repeatedly in real-time, we use Monte Carlo simulations to simulate doing the work thousands of times. Fortunately, it only takes seconds!
Two questions you can answer
When you're forecasting with Monte Carlo simulations you're likely trying to answer one of these two questions:
When will this specific number of work items be completed? (Fixed scope)
How many items can we complete by this specific date? (Fixed date)
Projects aren't the only situations that require us to answer these questions. You may need to forecast when you'll get to an item that's near the top of your backlog or you may need to help decide how many items to plan for in your upcoming Sprint. I'm sure you can think of more if you stop and think!
Running a Monte Carlo simulation
To run a Monte Carlo simulation you'll need to provide a few things:
A start date - Just as your GPS can't tell you when you'll arrive without knowing when you'll be leaving, the Monte Carlo can't tell you when you're likely to be finished if you don't provide a start date.
Throughput data - The simulation samples real Throughput data to project how much you might finish on each day of every trial run by the simulation. There are thousands and thousands of these trial runs in each simulation. The outcome of each of those trial runs is recorded and allows you to calculate the odds of what might happen in the future.
The fixed aspect - This is the desired end date when you have a fixed date or the number of items when you have a fixed scope.
Using the results to create a forecast
The tool you use for running the simulations controls how the results are presented. No matter how it is presented, it should provide you with the tools to create a probabilistic forecast - something like "There's an 85% chance that we'll finish
Like those above, every probabilistic forecast should have two pieces of information (shown in bold above):
a probability
a range of outcomes
The results can be shown in various ways depending on the tool you use. Here are two that we use in ActionableAgile:
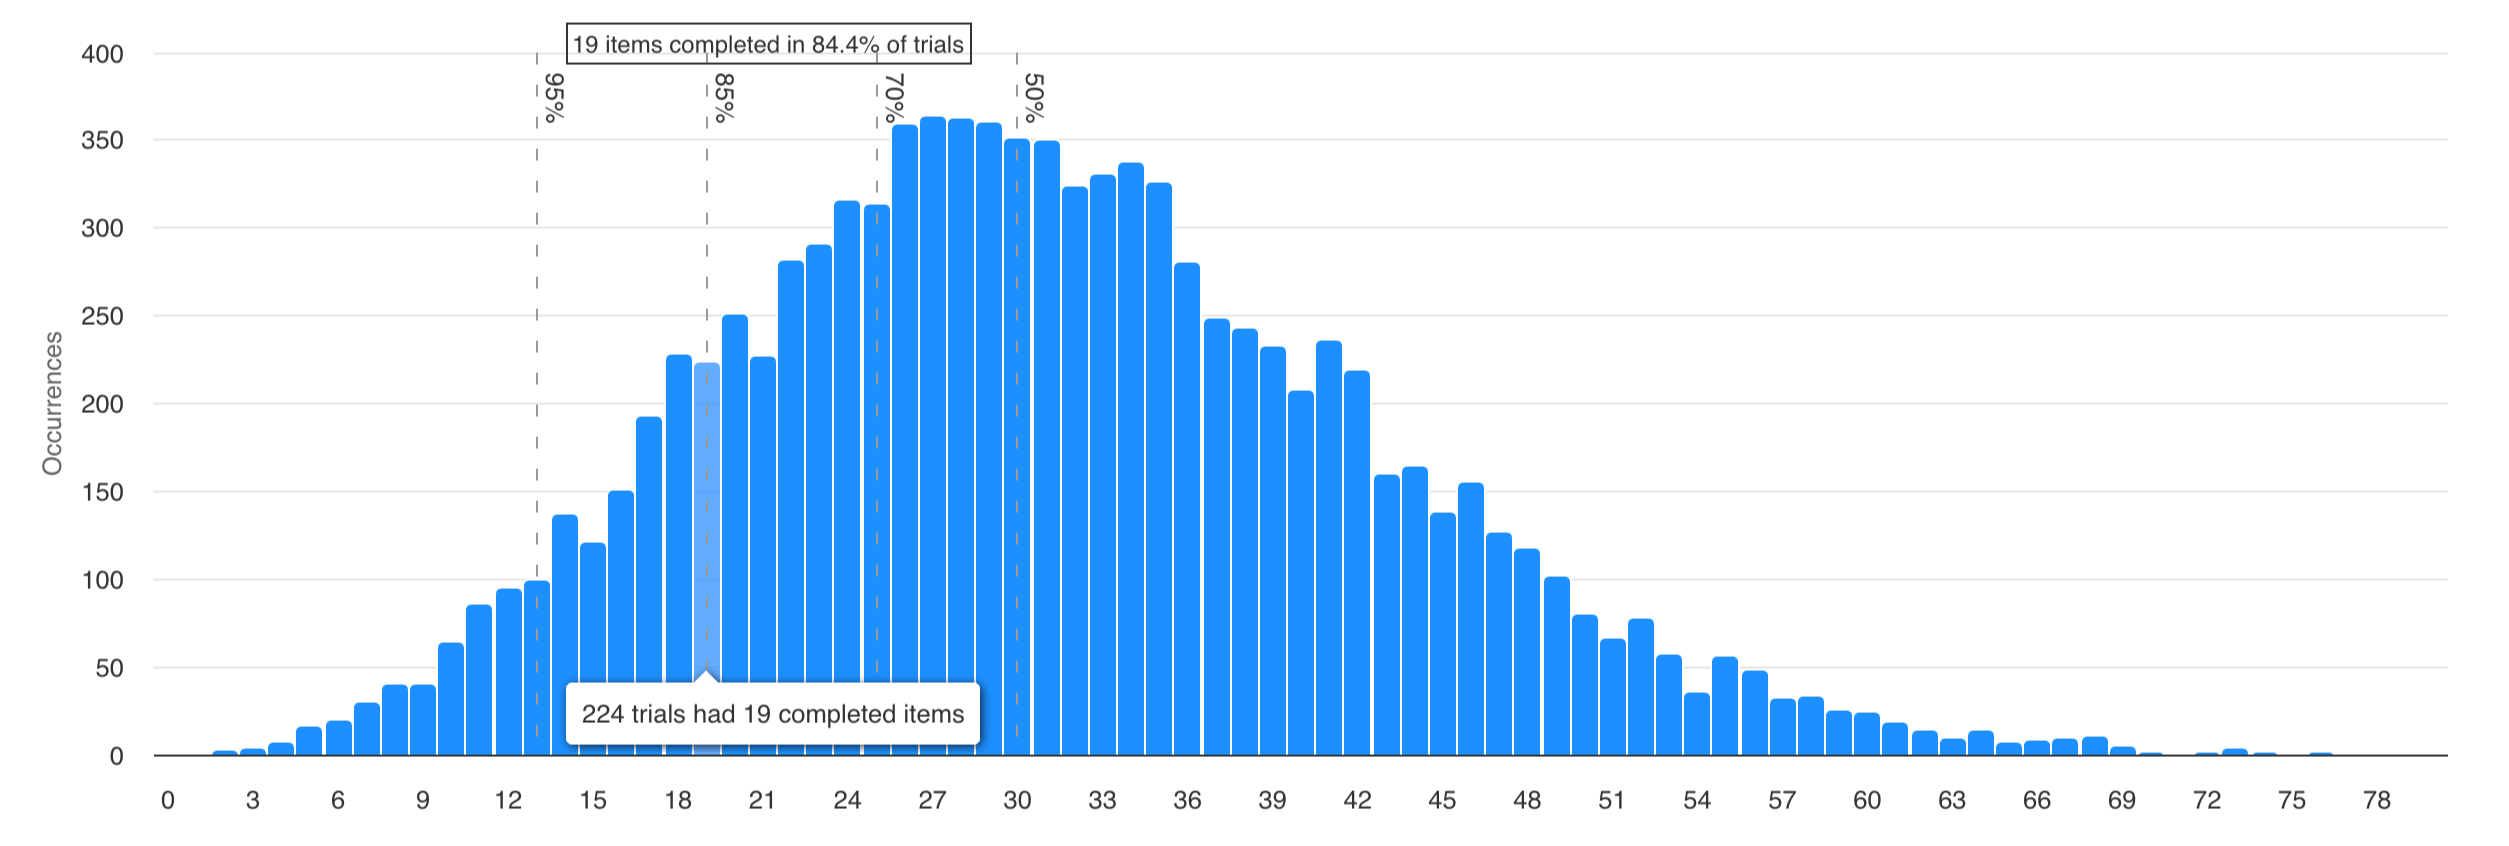
Histogram view - this is what you might think of as the raw data view. It shows the different outcomes that happened and the number of times each one happened. With this chart, it is quite simple to calculate probabilities. To find the 50% line, simply find the place where 5000 trials have taken place and then draw a line. For 85%, keep going until you find 8500 trials and do the same.
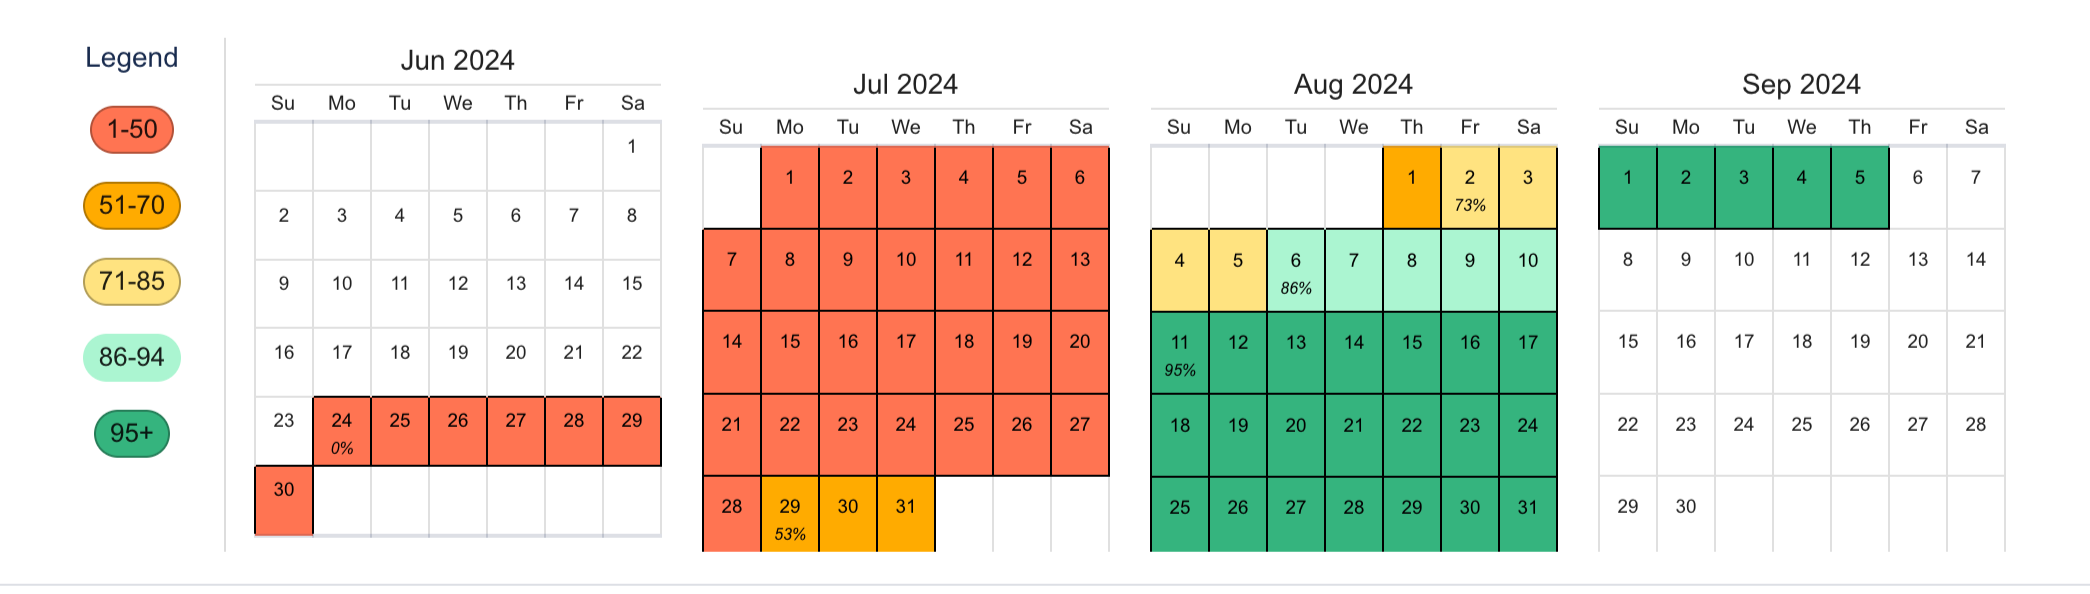
Calendar view - this is a user-friendly view of the information in the histogram. This view makes it simple to talk about other dates what it might take to change the odds of hitting those.
Considerations to keep in mind
Monte Carlo simulations only factor in conditions that were present when you generated your historical data (team size, skill set, work policies, etc.). If those conditions significantly change, you'll need to generate new data under the new conditions in order to have reliable forecasts using Monte Carlo simulations (as you would with any forecasting method that uses historical data).
Monte Carlo simulations often use random sampling of your historical data during the trial runs. When this is the case, as it is with our products, this means that every data point is as likely to be randomly selected as another. If you deliver 0 items most days, then most days in the simulation are likely to also have 0 delivered. In other words, you can deliver 10 items in the span of a week, but it matters how predictably those are distributed. You'll get better results if you work to have a more consistent delivery of a couple each day than aiming to deliver nothing for 4 days and 10 items on the fifth. To improve your predictability, and the resulting forecasts, focus on reducing Work Item Age.
Want a tool to help you get started with Monte Carlo Simulations?
You've definitely come to the right place. 55 Degrees offer two different products that use Monte Carlo Simulations to provide forecasts: Portfolio Forecaster for Jira and ActionableAgile (available as a SaaS app or embedded in Azure DevOps and Jira).
In ActionableAgile you can use Monte Carlo Simulations to provide forecasts for fixed scope and fixed date efforts. Portfolio Forecaster uses Monte Carlo simulations to forecast your Jira Epics or Versions, taking into account how many are in progress at one time and your historical Throughput.
Start now by trying either product for 30 days at no cost. We're always here to support you if you have any questions. Happy forecasting!