
Throughput is the count of work items your team completes per unit of time. In other words, it measures how much work gets done over a period.
You might have a Throughput of 2 per day, 10 per week, or even 17 per sprint. Whatever your preferred time unit, this flow metric helps you understand how quickly you finish work. It’s a simple metric, but very powerful for understanding your team’s delivery capacity and for planning.
Throughput is one of the four essential Kanban flow metrics (with Cycle Time, WIP, and Work Item Age) and gives insight into how quickly value is flowing out of your process
How do you calculate Throughput?
Calculating Throughput is straightforward. There are two things you need to decide on:
The time unit – e.g. per week, per month, per iteration. Choose a timeframe that makes sense for your context. Teams often use weekly or biweekly Throughput, especially if they’re doing Scrum (per sprint) or just want a steady pulse measure.
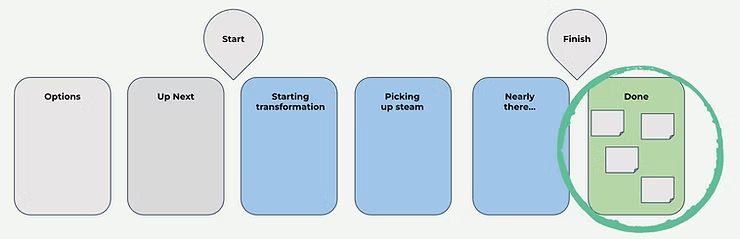
The finish line – define what counts as “completed” (usually items that reach the “Done” column or have a status like Resolved/Closed).
In the image below, work is considered started when it enters the In Progress column on the board. It is considered finished when it enters the Done column on the board.
Why should I care about Throughput?
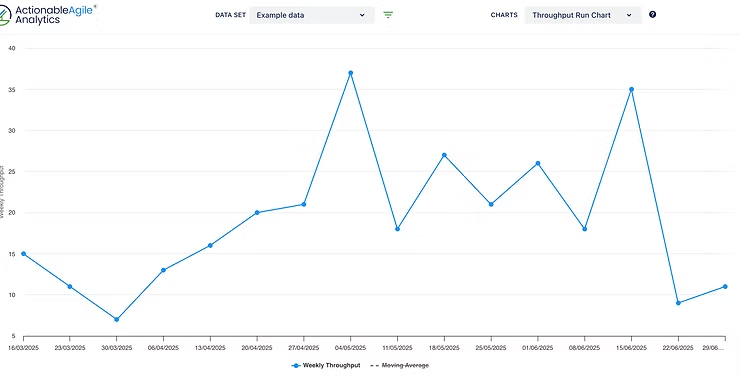
Looking at your Throughput allows us to analyze how consistently you deliver value. Consistency of throughput, and how it compares to the rate at which you start work, is one indicator of how stable your process is.
Perhaps the most common use for the Throughput metric is providing forecasts for completing multiple work items. You can use Cycle Time to forecast for single items, but you need a rate metric like Throughput to provide forecasts for groups of work items.
How do you use Throughput to forecast?
Traditionally, people use their Throughput to determine the average rate at which work is finished and then divide the total work by that average. However, forecasting based on averages will produce average results. Obviously, we don't suggest you do that.
Fortunately, you can use a Monte Carlo simulation that can use your Throughput data to simulate probable outcomes based on the variation found there. It’s a much more accurate, not to mention risk-aware, way to deliver forecasts. Read more about Monte Carlo simulations and forecasting.
Getting started
Teams often start looking at Throughput around the same time they begin looking at Cycle Time, WIP, and WIP Age. Focusing on building stability in these key flow metrics is a good start. The more stable your basic metrics are, the fewer outliers your forecasts have to account for and the more your forecasts are perceived as acceptable and, most importantly, accurate.
Ready to get started with flow metrics?
This guide walks you through what to measure, how to get your team aligned, and how to build a case for change that your stakeholders will actually care about.
It’s time to shift from intuition-driven to insight-driven delivery.
Download E-Book
Interested in tracking flow metrics like this one? Try out ActionableAgile for free and reach out if you’re interested in joining our customer success program!