Does your team have a lot of tasks going on at the same time?
WIP is an acronym for work in progress. So, the WIP flow metric measures the total number of work items that have been started – but not yet finished – at any given point in time. WIP is one of four key flow metrics, along with Cycle Time, Throughput, and Work Item Age.
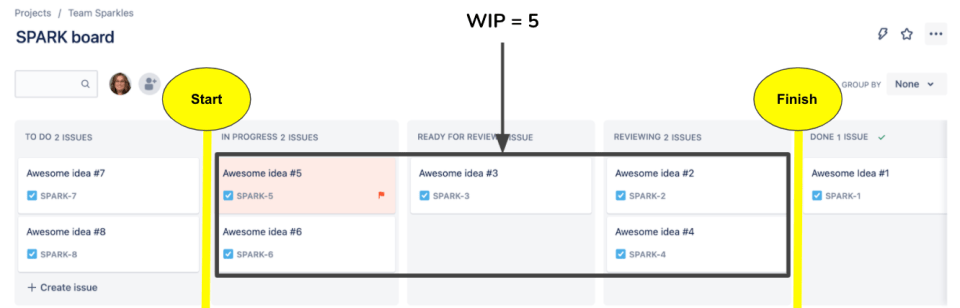
In practical terms, it’s how many cards are “in progress” on your board right now. If you’ve pulled five user stories into development and none are done yet, your current WIP is 5.
These flow metrics are interconnected – meaning, when one of these flow metrics changes significantly, you’ll see an impact on one or more of the others. Most of us have experienced this reality: the more you have in progress, the longer it takes to get each thing done. It makes sense. If we put all of our effort into one thing, that one thing will be finished faster than it would if we spread our time across multiple items. For more on this relationship, read about Little’s Law.
The amazing news is that this makes WIP a leading indicator of future Cycle Time, and it means that controlling your WIP can be a tool in your journey to help you deliver quickly and predictably.
How do you calculate WIP?
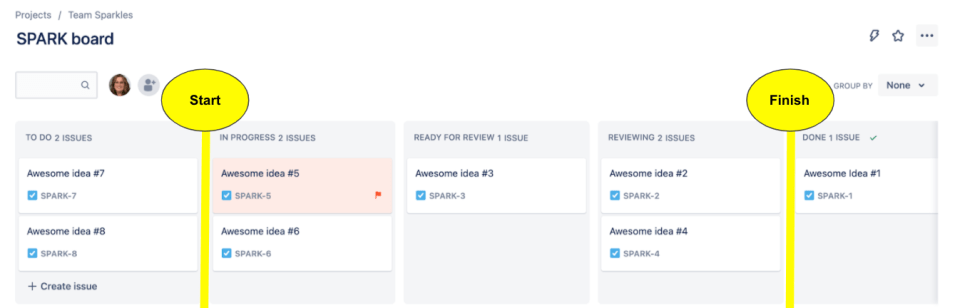
To begin calculating WIP, you need to have a defined process with two specific points identified:
Your Start Line – or the point in your process in which items are considered started
Your Finish Line – or the point in your process in which items are considered complete
In the image below, work is considered started when it enters the In Progress column on the board. It is considered finished when it enters the Done column on the board.
When you have those points defined, WIP is calculated as a simple count of work items between those two points. In the example above, we show a current WIP level of five (5).
Why should I care about WIP?
People can only do one ACTIVE thing at a time. You might be able to listen to music while working or something like that but you can't actually type or say two different things at one time. We are like single processors that way. So, when we have more things "in progress" at one time, we are switching back and forth between them. This makes each one take a bit longer to do than if you focused on just one thing at a time, not starting another until the first is finished.
While you may not be able to have only one thing in progress, you should understand the impact of higher WIP - in other words more task switching. Take a look at one of our past blog posts to see about a study we did with my team at the time regarding the unspoken cost of high WIP levels: Can you afford not to limit work in progress?
Higher WIP = Higher Delivery Costs
When too much work is in progress, each item takes longer to finish. Teams spend more time (and salary) per feature delivered.
A recent BCG study found over a third of software projects were delayed, and every delay postpones ROI. High WIP means you’re paying for people and resources longer before you get any value back.
Slow Delivery = Lost Opportunity
Piling up WIP slows your time to market. Customers get value late, which defers revenue and can miss market windows.
This AWS blog shares a great example on how a multitasking team delivered a mobile app 10 weeks later than necessary – missing a peak shopping season and delaying partner onboarding.
Pushing too many things at once also increases the cost of delay. This is the economic cost of delivering value later rather than sooner. In short, the more items in progress, the longer customers wait (and the longer your company waits to earn back its investment).
Getting started
Teams often start looking at WIP around the same time they begin looking at Cycle Time, Throughput, and WIP Age. Looking at the impact of your WIP on the other key flow metrics will provide insight into the WIP limits you might want to experiment with for your process. As your experiment goes on, see what impact the WIP limit change had on your Cycle Time and Throughput. Repeat this process until you get a result that you’re pleased with!
When using WIP in everyday work some examples can be seen below.
Before starting a new sprint or pulling in more work to avoid overloading the team.
In daily stand-ups if the team has many tasks in progress at once (flag high WIP).
When throughput drops or cycle time climbs – signs that WIP might be too high.
During retrospectives to see if too much work-in-progress caused delays.
When an urgent item arrives, to decide if something else should pause before adding it.
Ready to get started with flow metrics?
This guide walks you through what to measure, how to get your team aligned, and how to build a case for change that your stakeholders will actually care about.
It’s time to shift from intuition-driven to insight-driven delivery.
Download E-Book
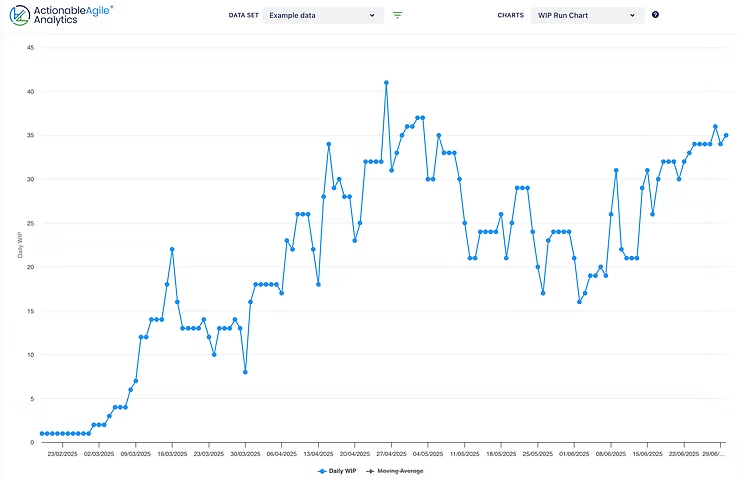
Interested in tracking flow metrics like this one? Try out ActionableAgile for free and reach out if you’re interested in joining our customer success program!