There are lots of signals that you can get from visualizing your work - especially on a Kanban board. You can see bottlenecks, blockers, and excess work-in-progress, but one signal you don't often get to see is the answer to the question, "How much longer from here?"
Now, to get that signal, you have to have a process that models flow. By flow, I mean the movement of potential value through a system. Your workflow is intended to be a model of that system. When built in that way, your workflow allows you to visualize and manage how your potential value moves through your system.
Managing flow is managing liability and risk
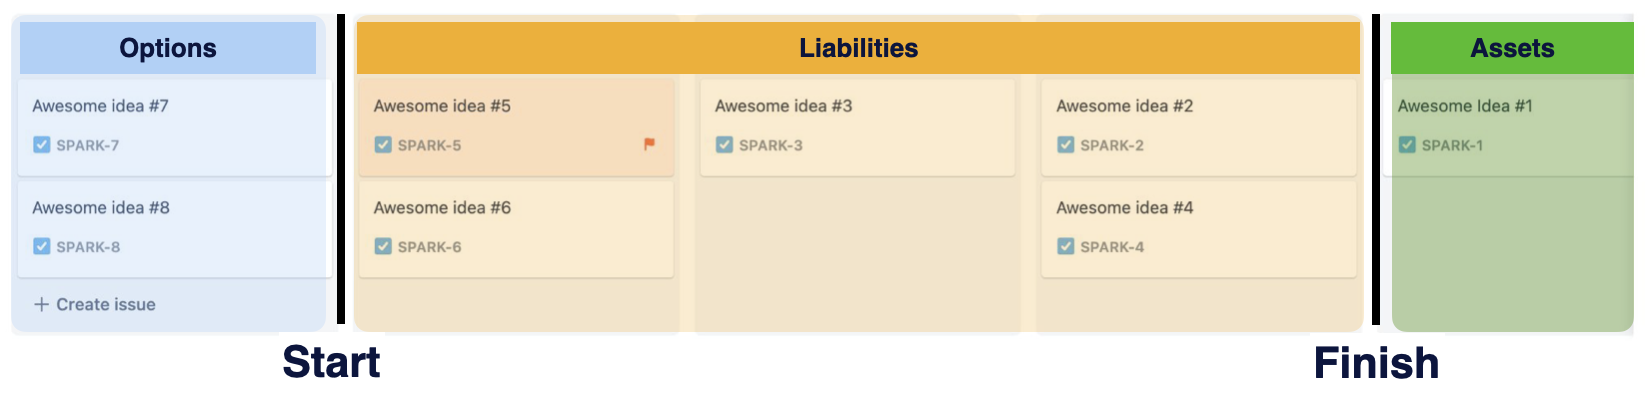
A tip is to look at your workflow from a financial perspective. Work items you haven't started are options that, when exercised, could deliver value. Work items you have finished are (hopefully) assets delivering value. The remainder - all the work items that you've spent time and money on but haven't received any value in return yet (work-in-progress) are your liabilities.
What this helps us clearly demonstrate is that our work-in-progress is where most of our risk lies. Yes, we could have delivered things that don't add value (and hopefully, there are feedback loops to help identify those situations and learn from them.) You can also have options that you really should be working on to maximize the long-term value they can provide. But, by far, the biggest risk we face is taking on too much liability and not managing that liability effectively - causing us to spend more time and money than we should to turn them into assets.
Expectations versus reality
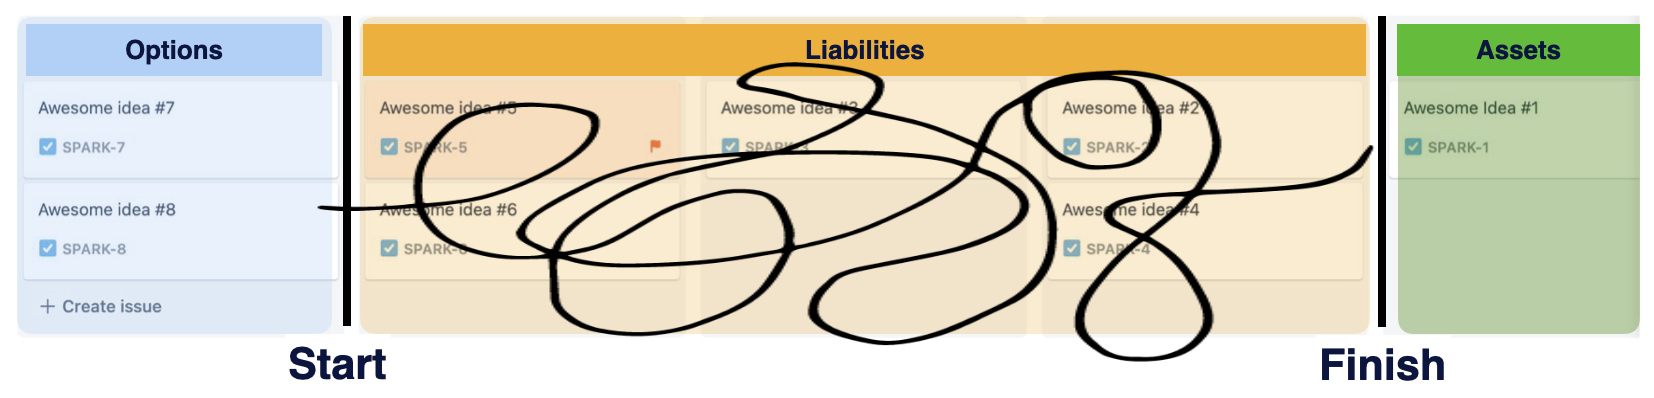
We, humans, have a tendency to look at things with rose-colored glasses (ok, most of us do.) So, when we start a piece of work, we think it will have a nice, straight, and effective trip through the workflow with no u-turns or roadblocks. More often than not, that's not the case, and there are many reasons for that.
One of the biggest reasons is how we build our workflow. When we build our workflow to model the linear progression of work as it moves from an option to an asset, you're more likely to have that straight path. If you build your workflow to model anything else - especially the different groups of people that will work on it then you end up with an erratic path.
You can get a picture of how work moves between people (if you use tools like Inspekt). But what you don't get is a picture of how work moves through a lifecycle from option to asset. This is a problem if you think you're using your workflow to help optimize flow because you aren't seeing the signals you think you are. In a situation like this, what you have is a people flow -- not a work flow. That's great if you want to focus purely on managing resource efficiency (keeping people busy) but poor if you want to optimize flow and control your liabilities.
The signal you can only get from a true workflow
Once you can truly say that you have modeled the life cycle of turning options into assets, you can say that a card's position in the workflow reflects how close or far away it is from realizing its potential value.
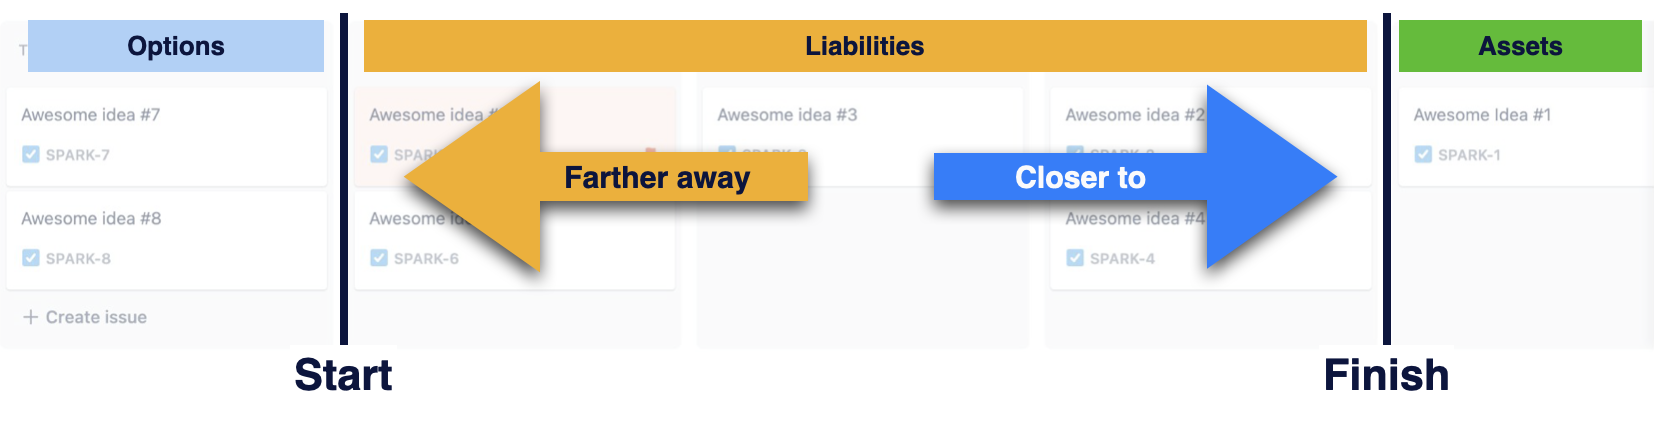
What this means is that when you move to the right in your workflow, then you're signaling you're closer to turning the liability into an asset, and when you move it to the left (backward) in your workflow, you're moving farther away from that outcome. (Does it make more sense now why we handle backward movement the way we do in ActionableAgile now?)
Model your workflow so that how you move a work item is signal of movement towards or away from realising its potential value
When you can say this, then you can start signaling how long an item is likely to take to become an asset. With tools like ActionableAgile's Cycle Time Scatterplot, you can see how long it's likely to take for an item to be completed from any workflow stage. It's like when you go to Disney World or someplace like it, and you're in line for a ride, and you see a sign that says your wait is 1 hour from this point. Each column of your workflow can have that metaphorical sign. Except you can also know the likelihood associated with that information.
Want to make a change?
Don't stress if you just learned that your workflow isn't all it's cracked up to be. You can make a change! It's all about board design and policies. If you want tips on how to change your board or process, check out my blog post on how to design your board to focus on flow, or watch my talk below on this topic from Lean Agile London 2022!