The Ongoing Battle of Agile vs Waterfall
Agile teams often face challenges in predicting project timelines and delivery dates due to the framework's inherent flexibility, which prioritizes adaptability over rigid schedules.
While this approach aligns with Agile principles, most IT departments operate within yearly budgets that require some level of forecasting to understand when funded initiatives are to be completed. But scoping out an entire year’s worth of work is not only inefficient but also counterproductive to Agile’s iterative nature.
Traditional approaches, such as deterministic forecasting (forecasting to a single date) commonly used in waterfall methodologies, attempt to map out the entire scope, timeline, and resource allocation for a project upfront. However, this assumes that requirements, priorities, and team performance will remain static Throughout the project lifecycle, a notion that rarely aligns with the realities of modern software development.
When unexpected changes arise (e.g., shifting priorities, evolving customer needs, or unforeseen technical challenges), deterministic plans become obsolete, leading to missed deadlines, mismanagement, and stakeholder frustration.
So, what's a team to do when they are stuck in this conundrum? How can teams forecast work enough to satisfy the planning and budgetary needs of most IT departments while staying nimble enough to produce high-quality, useful software features?
This is where Agile Forecasting using Flow Metrics and Monte Carlo Simulation comes in handy.
A Smarter Way to Forecast
In contrast to more rigid waterfall planning, predictive approaches like Agile Forecasting are better suited for today’s dynamic software development environment. By leveraging historical data and probabilistic models, Agile Forecasting embraces variability and uncertainty, allowing teams to provide a realistic range of outcomes associated with a probability of success, rather than a fixed, single date that often results in unrealistic predictions.
Techniques like Monte Carlo Simulations and flow metrics help teams forecast delivery timelines and Throughput with greater accuracy, enabling more informed decision-making and proactive risk management.
Agile Forecasting bridges the gap between the adaptability of Agile and the need for predictability in IT planning. It empowers teams to achieve realistic goals without compromising flexibility, delivering value iteratively while meeting business expectations.
In this post, we’ll delve into how Agile Forecasting, powered by tools like Monte Carlo Simulations and flow metrics, can revolutionize the way teams plan, execute, and deliver their work.
The Case for Agile Forecasting
Agile forecasting is a method used to predict how much work a team can complete within a given timeframe by leveraging historical data and current performance metrics.
Unlike deterministic approaches, such as the upfront, rigid project planning typical of the waterfall methodology, it embraces variability and applies probabilistic thinking to deliver a more accurate range of potential outcomes. By adopting agile forecasting, teams can:
Set achievable goals:
Use historical data and flow metrics to make realistic predictions about what the team can complete.
Manage risks effectively:
Leverage probabilistic forecasting to account for variability and visualize bottlenecks with Cumulative Flow Diagrams (CFD) and flow metrics.
Use Monte Carlo Simulations to create contingency plans and apply Work in Progress (WIP) limits to reduce Cycle Times.
Improve stakeholder confidence in delivery timelines:
Provide data-driven forecasts using Monte Carlo Simulations and refine them continuously with updated metrics.
Flow Metrics: The Foundation of Agile Forecasting
Flow metrics are essential for understanding how efficiently work moves through a development process. The key metrics include:
Cycle Time: The time it takes for a work item to move from start to finish.
Work in Progress (WIP): The number of active items being worked on.
Throughput: The number of items completed in a given time period.
Work Item Age: The elapsed time since work on an item started.
Applying Flow Metrics in Practice:
Sprint Planning: Use throughput to determine how much work to pull into a sprint, moving away from deterministic velocity metrics.
Retrospectives: Analyze Cycle Time scatterplots to identify patterns or outliers and improve processes.
WIP Limits: Leverage Little’s Law (a principle linking WIP, Throughput, and Cycle Time) to understand how limiting WIP improves Cycle Time and overall flow efficiency.
Monte Carlo Simulations: A Powerful Tool for Forecasting
Monte Carlo Simulations (MCS) is a computational algorithm that uses repeated random sampling to generate probabilities for a range of outcomes. In agile forecasting, MCS helps answer critical questions:
How many items can we close by a target date?
When will a specific number of items be completed?
How many items can we close by a target date?
This question is answered by running simulations using historical Throughput data (e.g., the average number of items completed per sprint). By analyzing this data, the simulation generates a probability distribution that predicts how many items are likely to be completed by a specific date.
For example, the output might indicate there is an 85% chance of completing 20 items, or 70% chance of completing 25 items, by the end of the next sprint. This insight helps teams set realistic expectations and manage scope effectively within a defined timeframe.
When will a specific number of items be completed?
To answer this, the simulation uses the same historical Throughput or Cycle Time data to estimate the range of dates by which a set number of items can be delivered. The result is expressed as probabilities, such as a 90% likelihood of completing 30 items within 25 days.
This information is particularly valuable for fixed-scope projects, where knowing the approximate completion date is critical for planning and stakeholder communication.
Monte Carlo Simulations in Action with ActionableAgile® Analytics
Monte Carlo Simulations can be run using general analytics tools, but those often require extra setup and manual work. ActionableAgile® Analytics streamlines the process, making forecasting faster and easier.
It automatically collects your historical Throughput and Cycle Time data from Jira (or Azure DevOps) and runs thousands of simulations in seconds, delivering clear, visual probability forecasts without the need for complex setup.
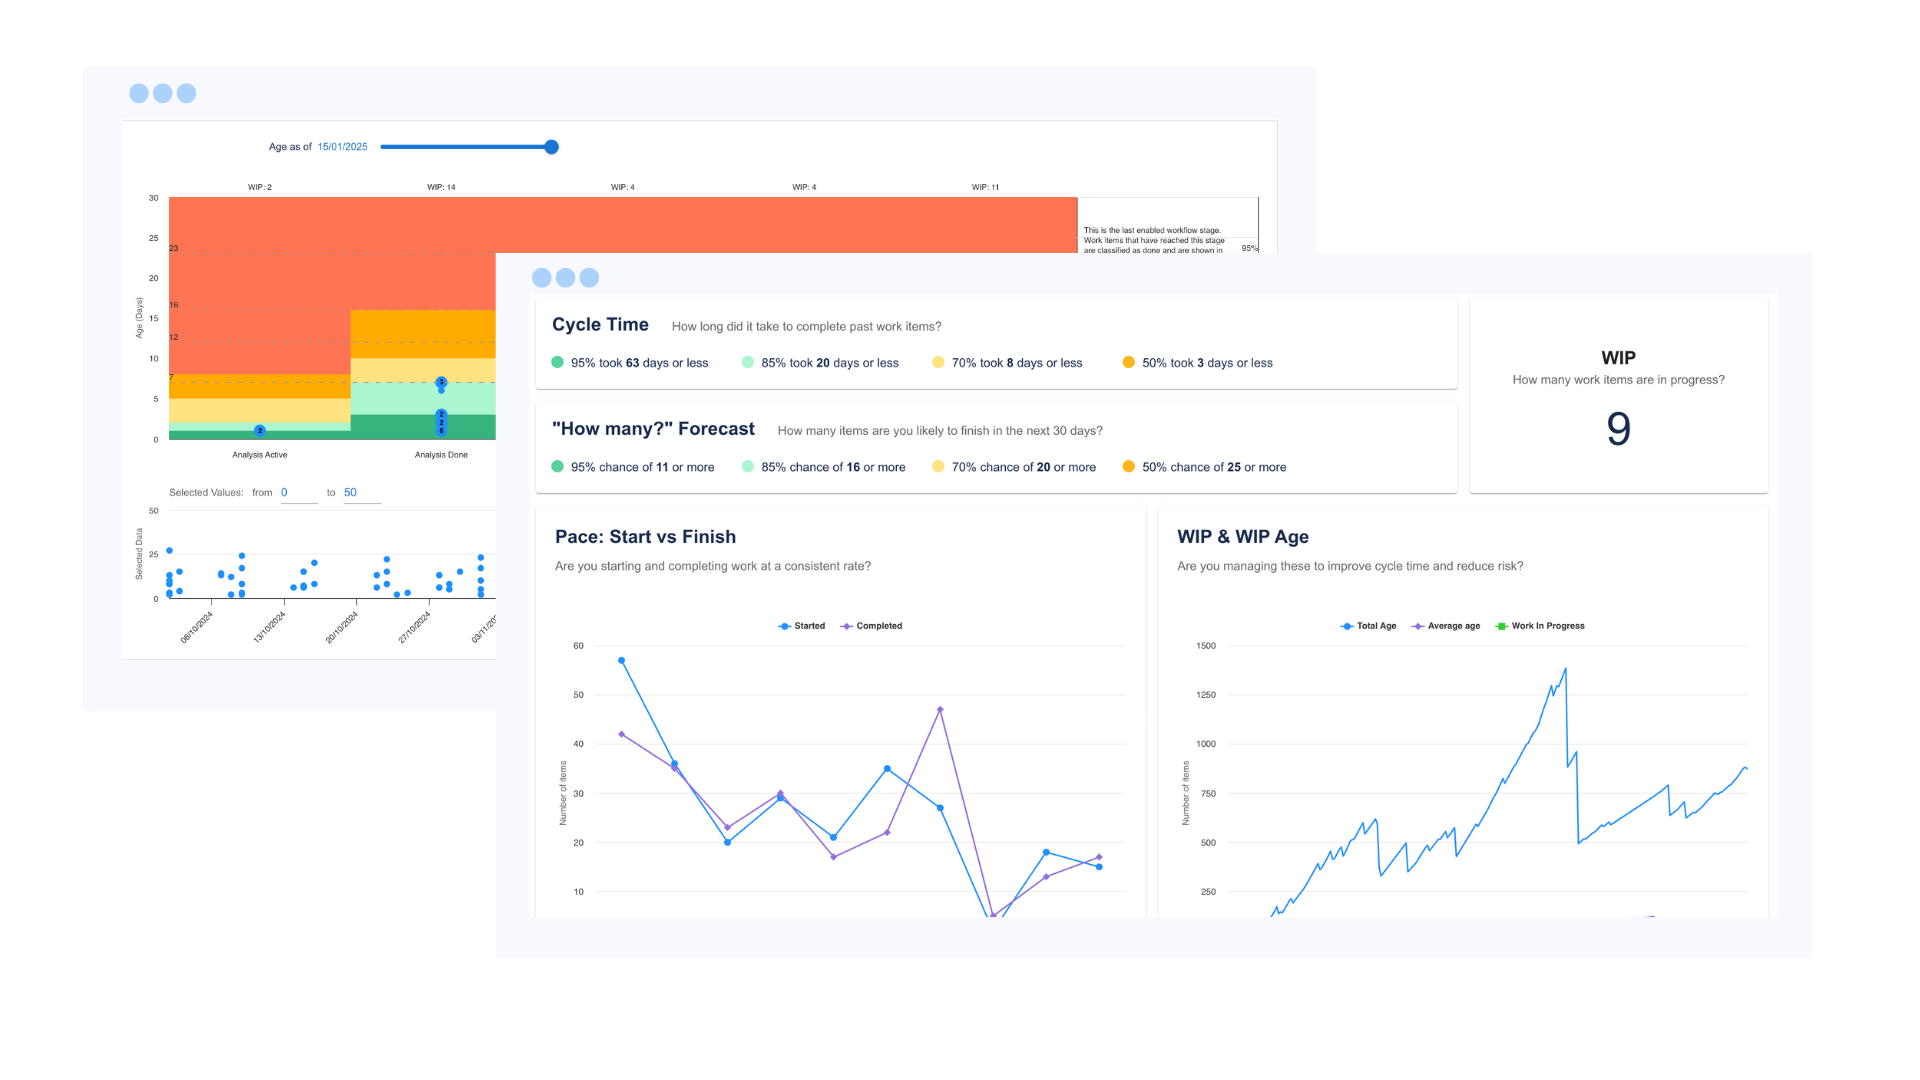
With ActionableAgile® Analytics, teams can:
Instantly generate probability charts showing the likelihood of hitting specific delivery targets.
Visualize forecasts alongside real-time flow metrics such as WIP, Throughput, and Cycle Time for a complete picture of performance.
Adjust variables dynamically to explore what-if scenarios and assess how changes in WIP, scope, or team Throughput might affect outcomes.
This blend of empirical data and simulation-based forecasting gives teams and stakeholders the confidence to plan realistically, manage risk proactively, and adapt without losing predictability.
How It Works
Gather Historical Data: Collect Throughput or Cycle Time data (e.g., completed tasks per sprint). Even a few weeks’ worth of data is enough to start.
Run Simulations: Use this data to simulate thousands of possible outcomes, accounting for variability and uncertainty.
Generate Probabilities: Calculate the likelihood of achieving specific delivery goals, instantly visualized through tools like ActionableAgile® Analytics.
For example, an MCS might show there’s an 85% chance of completing 20 items in the next sprint. This approach is especially useful for fixed-scope or fixed-date projects, providing actionable insights into what’s achievable.
Continuous Improvement with Agile Forecasting
Agile Forecasting isn’t a one-time activity. It’s a continuous cycle of inspection, adaptation, and learning. By regularly analyzing flow metrics and leveraging probabilistic tools like Monte Carlo Simulations through ActionableAgile® Analytics, teams can refine their workflows, improve predictability, and deliver value more consistently.
Tools and Resources to Get Started
Ebook: If you'd like a deeper dive into getting started with Flow Metrics, you can download the free ebook.
Ready to get started and understand flow metrics?
If you’ve been curious about Flow Metrics but unsure where to start, this guide breaks it down in a straightforward, human way.
No jargon. No complexity. Just practical steps toward more predictable delivery.
Download E-Book
Books: When will it be done by Daniel Vacanti and Actionable Agile Metrics for Predictability: Tenth Anniversary Edition by Daniel Vacanti
Tools: ActionableAgile® Analytics
By adopting these techniques and tools, your team can shift from guesswork to reliable, evidence-based forecasting, delivering work with confidence, clarity, and predictability.
This article is part of a collaboration between 55 Degrees and Leading EDJE, combining expertise in agile forecasting and evidence-based management to help teams plan smarter and deliver value predictably.