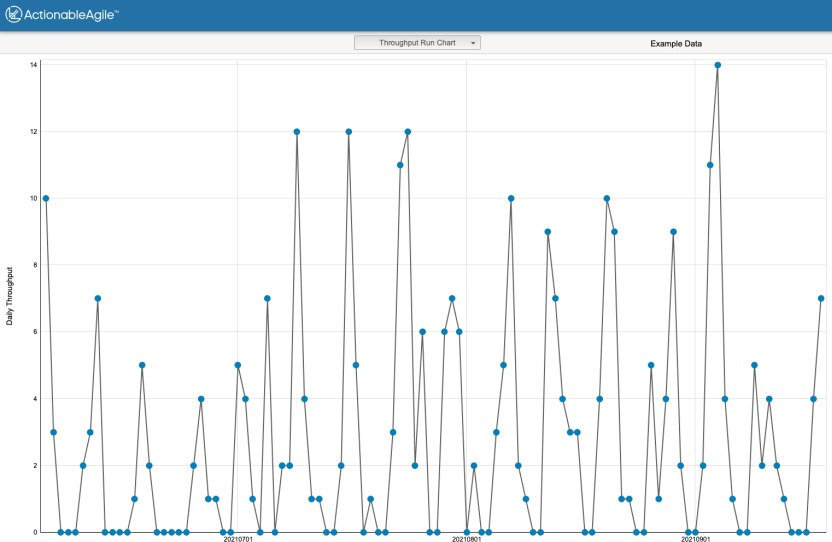
Analyzing Throughput in ActionableAgile
Throughput is a flow metric that tells us about the rate work items are finished in a given process. ActionableAgile has multiple charts that can give you ...
Jul 18, 2022
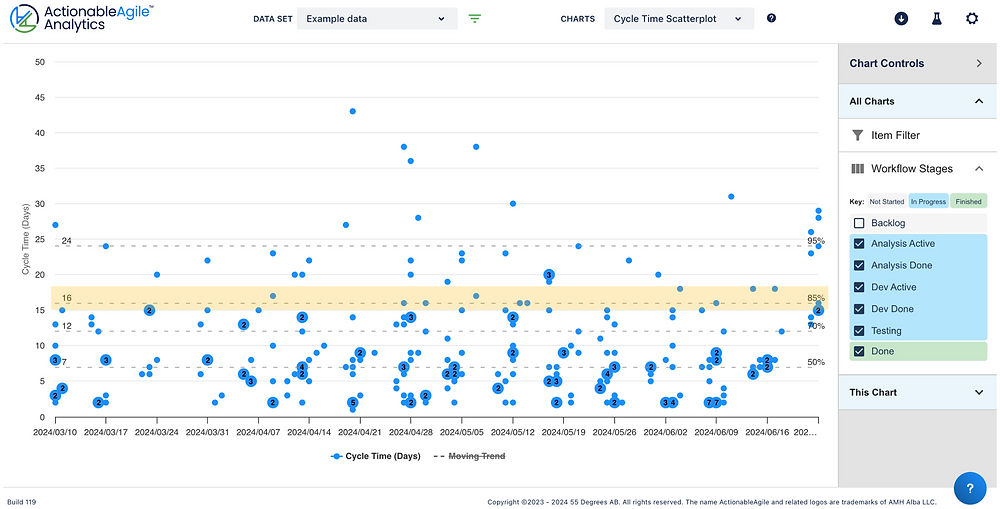
What is a Cycle Time Scatterplot?
The Cycle Time Scatterplot chart is arguably the best way to view your Cycle Time data - the total elapsed time it took for individual items to move from one ...
Jul 17, 2022

Monte Carlo Simulations and Forecasting
When you hear Monte Carlo you probably have thoughts of the Formula One Grand Prix and extravagant casinos. At 55 Degrees, when we talk about Monte Carlo ...
Jun 14, 2022

When forecasts differ from estimates
At 55 Degrees, we think probabilistic forecasting is great. Heck, it is a key feature in our products ActionableAgile Analytics and Portfolio Forecaster. By ...
Feb 19, 2022

What if there is no right or wrong?
Sometimes you need to change your approach When I watch the news, read social media, or listen to arguments about how to do something, I am struck by how far ...
Feb 19, 2022

Want success? Accept Uncertainty.
In business, the quest for predictability is universal. We all want to grab hold of the reality we face everyday and, somehow, bend it to our will. When we are ...
Feb 19, 2022

Time to get rid of all the managers?
A presentation at the Øredev developer conference in Malmö
Feb 19, 2022

How many sprints for a forecast?
Probabilistic forecasting via Monte Carlo Simulations are a key feature of two of our products, ActionableAgile Analytics and Portfolio Forecaster. These ...
Feb 17, 2022

Moving cards backwards on your Kanban board
Almost all teams occasionally move a card backwards on their Kanban boards for one reason or another. Moving cards backwards isn’t always a bad thing but, ...
Oct 5, 2021