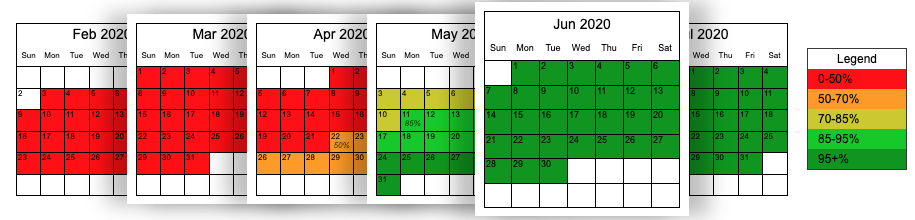
A probabilistic forecast is one that acknowledges a wide array of possible outcomes and assigns a probability, or likelihood of happening, to each. This makes it the perfect method for forecasting in uncertain situations like at work!
What makes a forecast probabilistic?
Every probabilistic forecast should have 2 components: a range and a probability.
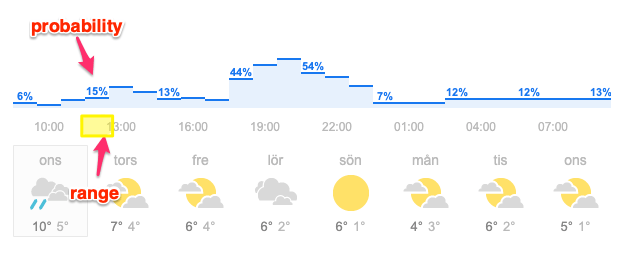
In the image above you see that there's a 15% chance that it will rain sometime between 12:00 and 13:00. It's not saying that it will rain the entire time. Just that, there's a 15% chance that sometime in that hour you will experience some rain. This also means that there's an 85% chance that you won't.
What data is needed for probabilistic forecasting?
When it comes to probabilistic forecasting at work, you're usually trying to answer one of these questions:
When will this piece of work be done? aka How long will it take? (Single work item)
When will this collection of work be done? (Multiple work items - fixed scope)
How much work can we complete by a specific date? (Multiple work items - fixed date)
To answer these questions you need to know some basic information about your past work:
when each item started and
when it finished.
With this minimal data you can learn a lot about your system and what it can produce. Keep in mind this underlying rule of thumb: the conditions you had when you generated that data need to be roughly similar to the conditions you expect for the period you're forecasting. When you do this, you can use your data to forecast what is likely to happen in the future.
How do I forecast an individual work item?
To know how long it is likely to take for an individual piece of work to be completed, you want to look at how long it has taken you to complete work in the past. This data is called your Cycle Time. You can look at this data on a Cycle Time Scatterplot to quickly see what percentage of item finished in a certain range of time.
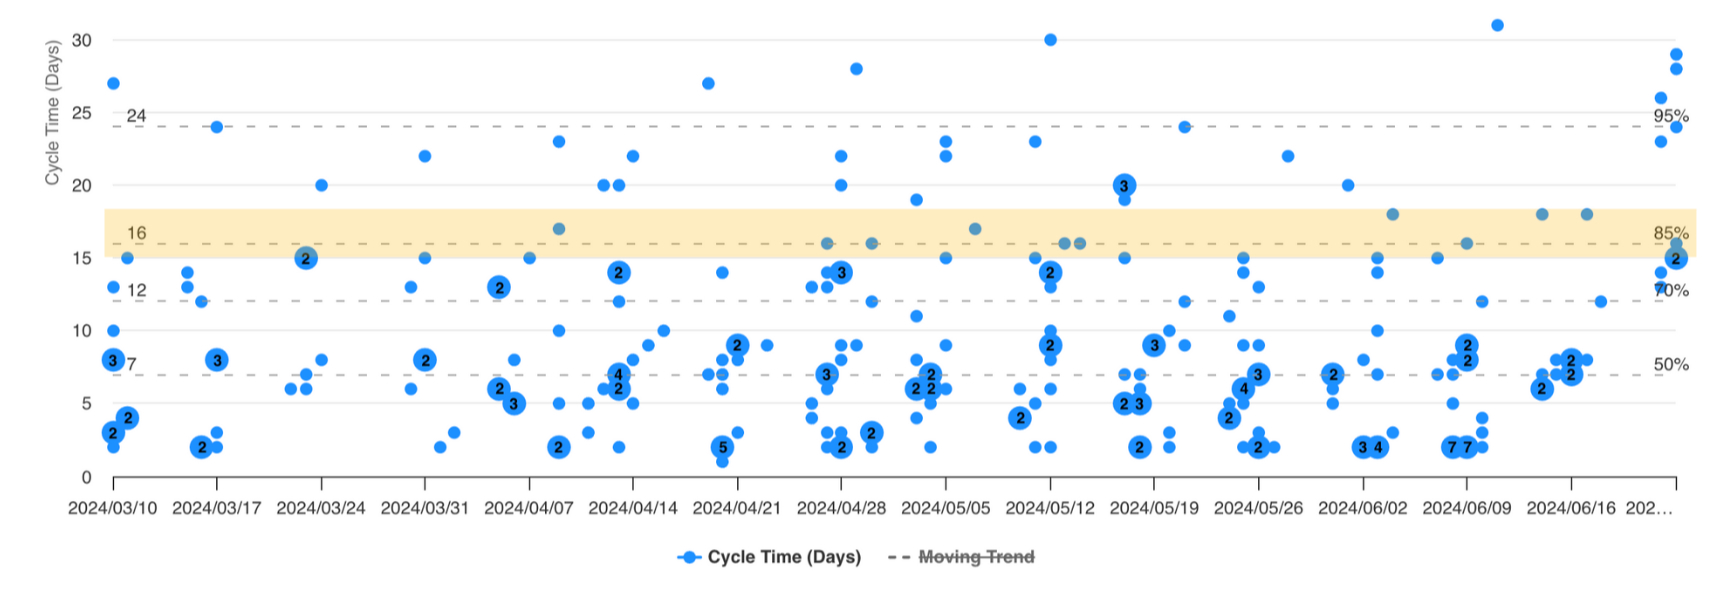
The percentage you choose becomes your probability (component 1) and the range (component 2) is all the possible cycle times up to and including the line. You can see from the data above that 85% of work items finished in 16 days or less. You can turn that into the following probabilistic forecast: There's an 85% chance that you'll finish a work item in 16 days or less.
By the way, this means from when it starts!
What about larger efforts?
If you need to provide a forecast that includes more than one item you can't just add individual forecasts together. You need to understand the rate at which you finished work in the past. Fortunately, that's exactly what the flow metric called Throughput tells yo.
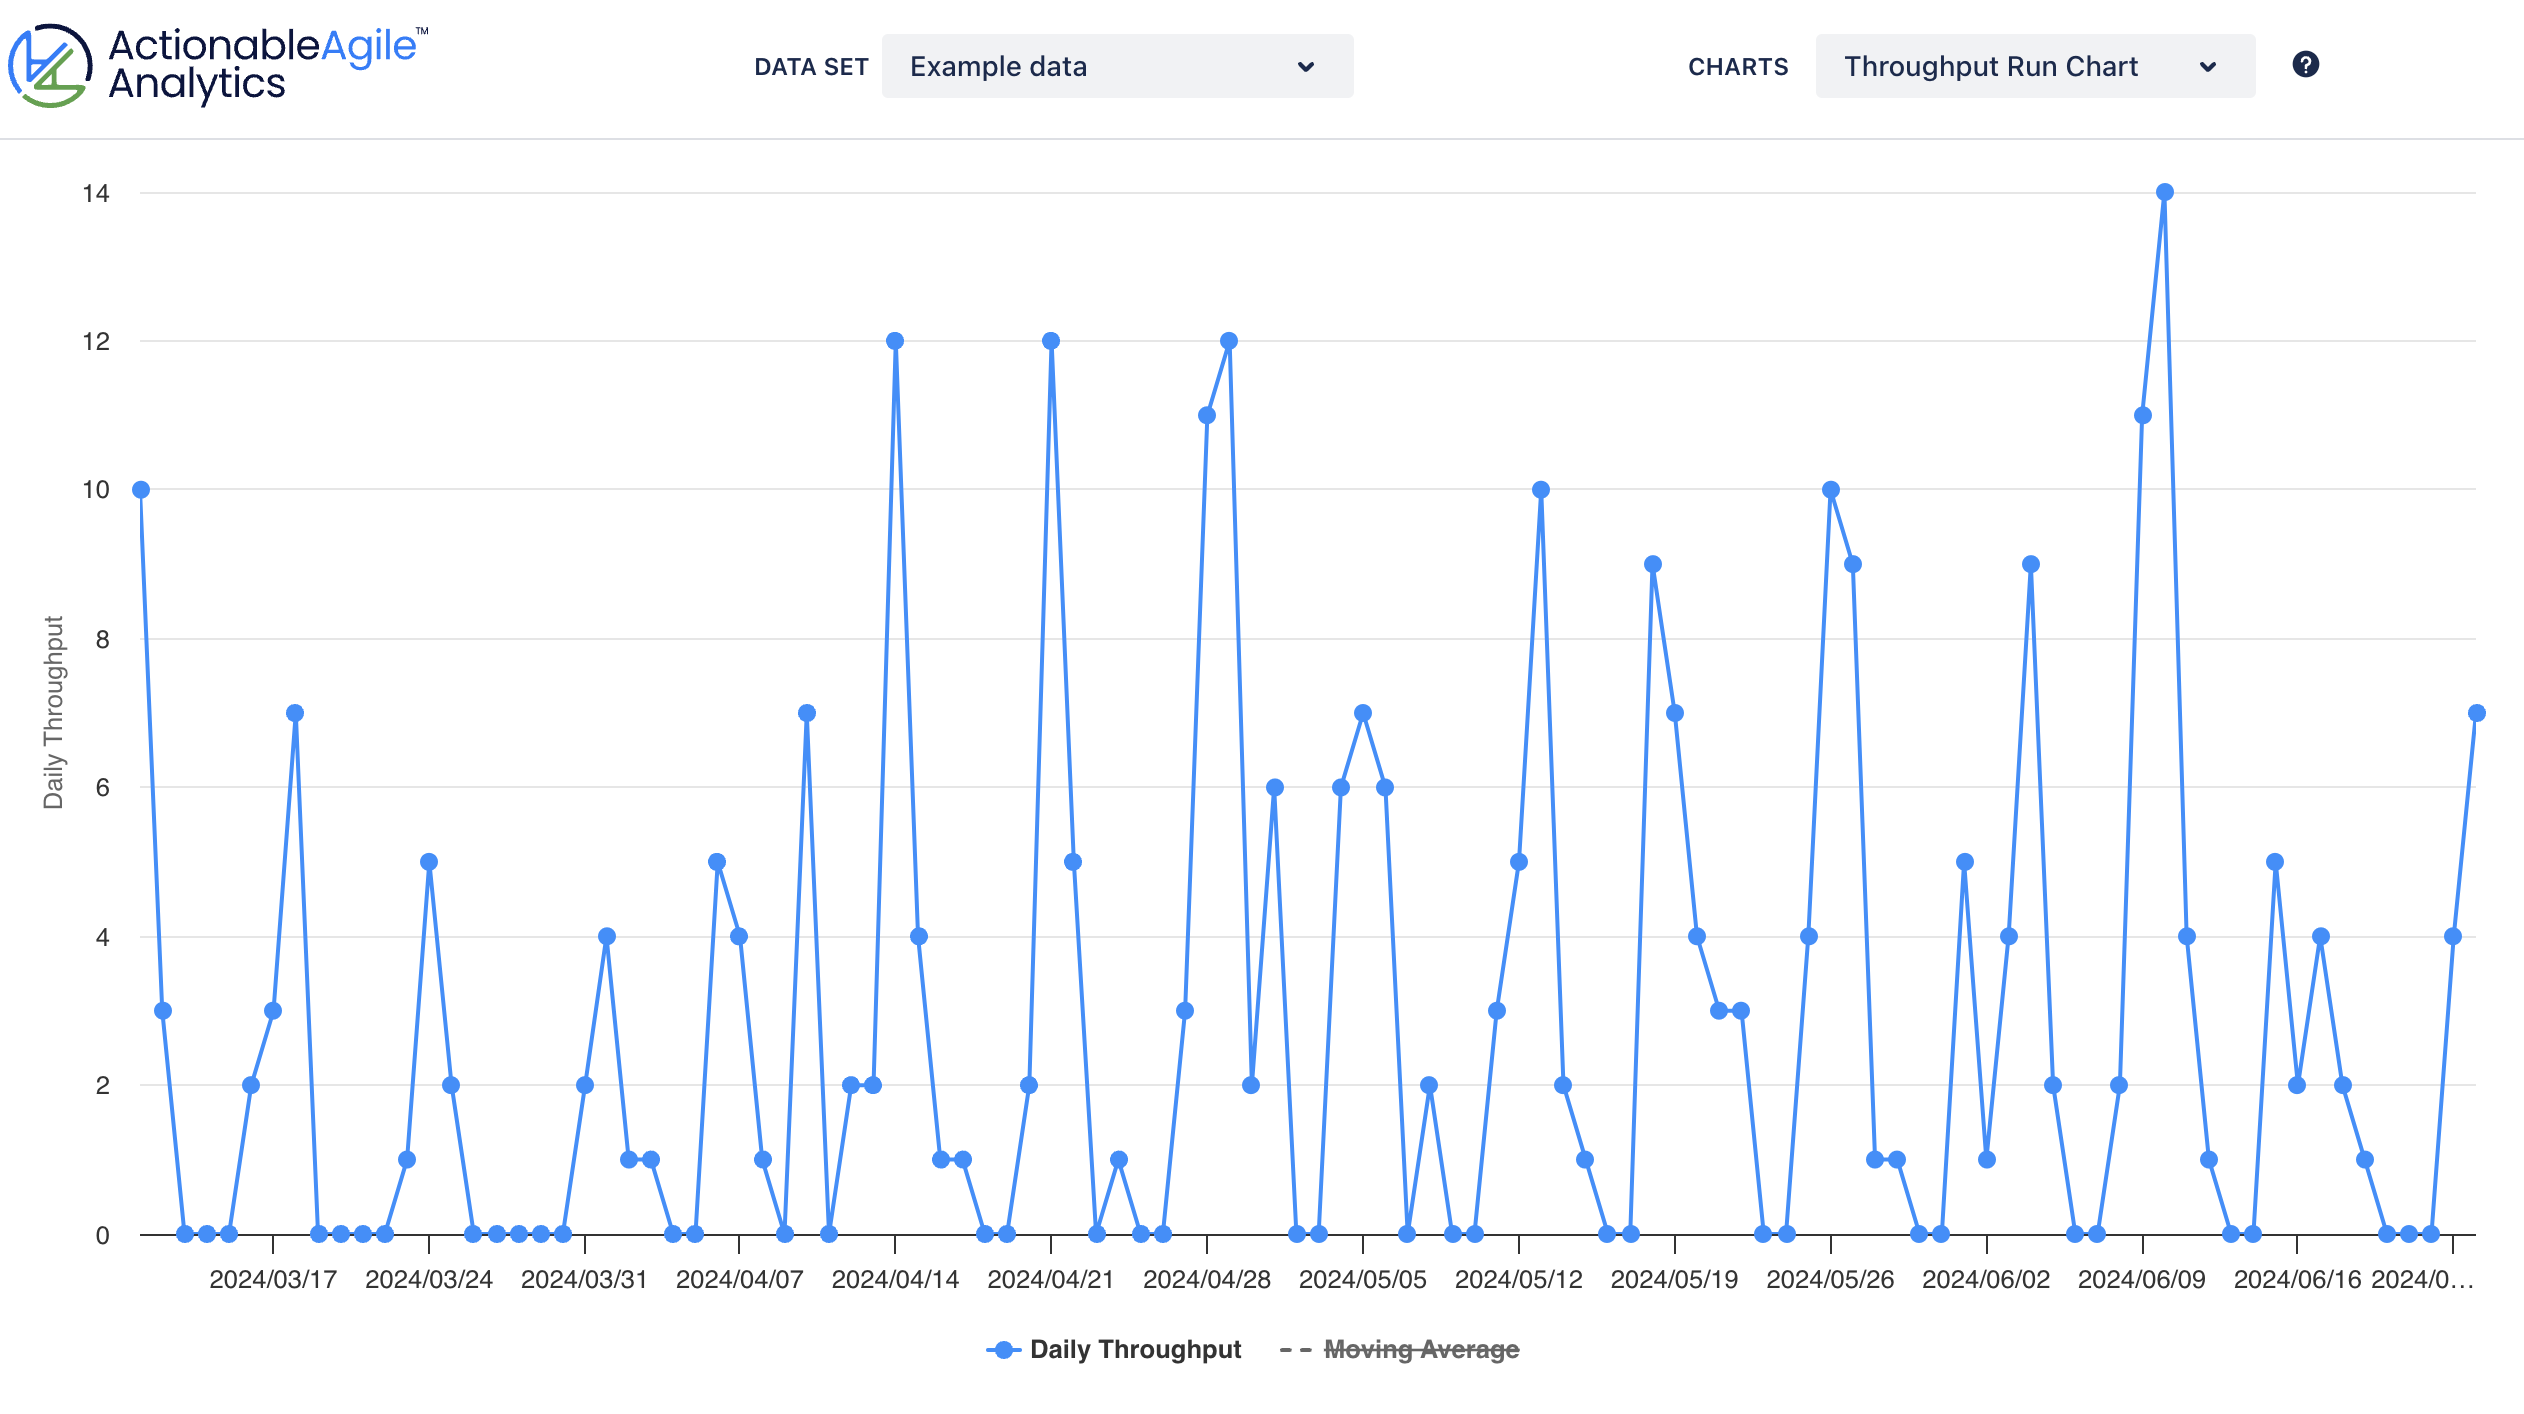
However, it is not as easy as looking at your Throughput data on a chart as you can with Cycle Time. If you use the Run Chart for this you can only look at what's likely to happen for one time unit. For most of your forecasts we'll need more than one of those. 😃 So, in these situations you can use a tool called a Monte Carlo simulation. (Learn more about Monte Carlo simulations)
How do I forecast for a fixed scope?
Sometimes you're trying to find out when a specific amount of work can be completed. That's what we call a fixed scope forecast. Entering a start date and the number of items you have in scope into a Monte Carlo Simulation can help you see how likely you are to finish that scope of work on any given day and it can tell you the probabilities of a range of outcomes using your data.
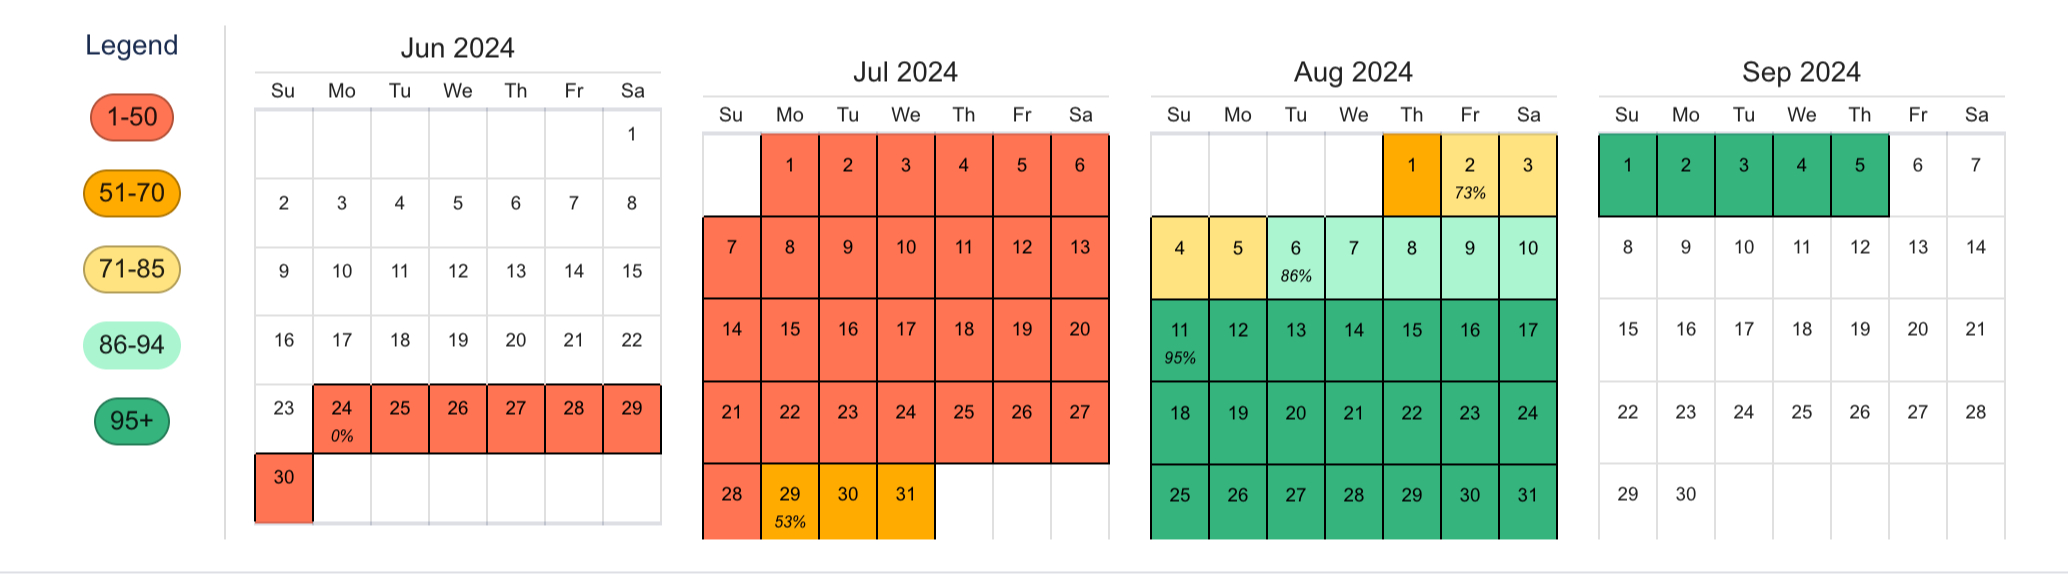
For example, from that data in the image above you can say "There's an 85% chance that we'll finish this scope of work on or before May 11th". If that's not ideal you can look to other dates to see how likely they are and then have conversations about what you'll need to do to make that more likely or, perhaps, have discussions about changing expectations to be more realistic.
How do I forecast for a fixed date?
If you're working towards a fixed date rather than a fixed scope, the process is almost exactly the same but with one tiny twist. Instead of providing the number of items you have in scope, you provide your fixed date as a finish date. Now it can tell you how many items you are likely to finish by that date with any given probability.
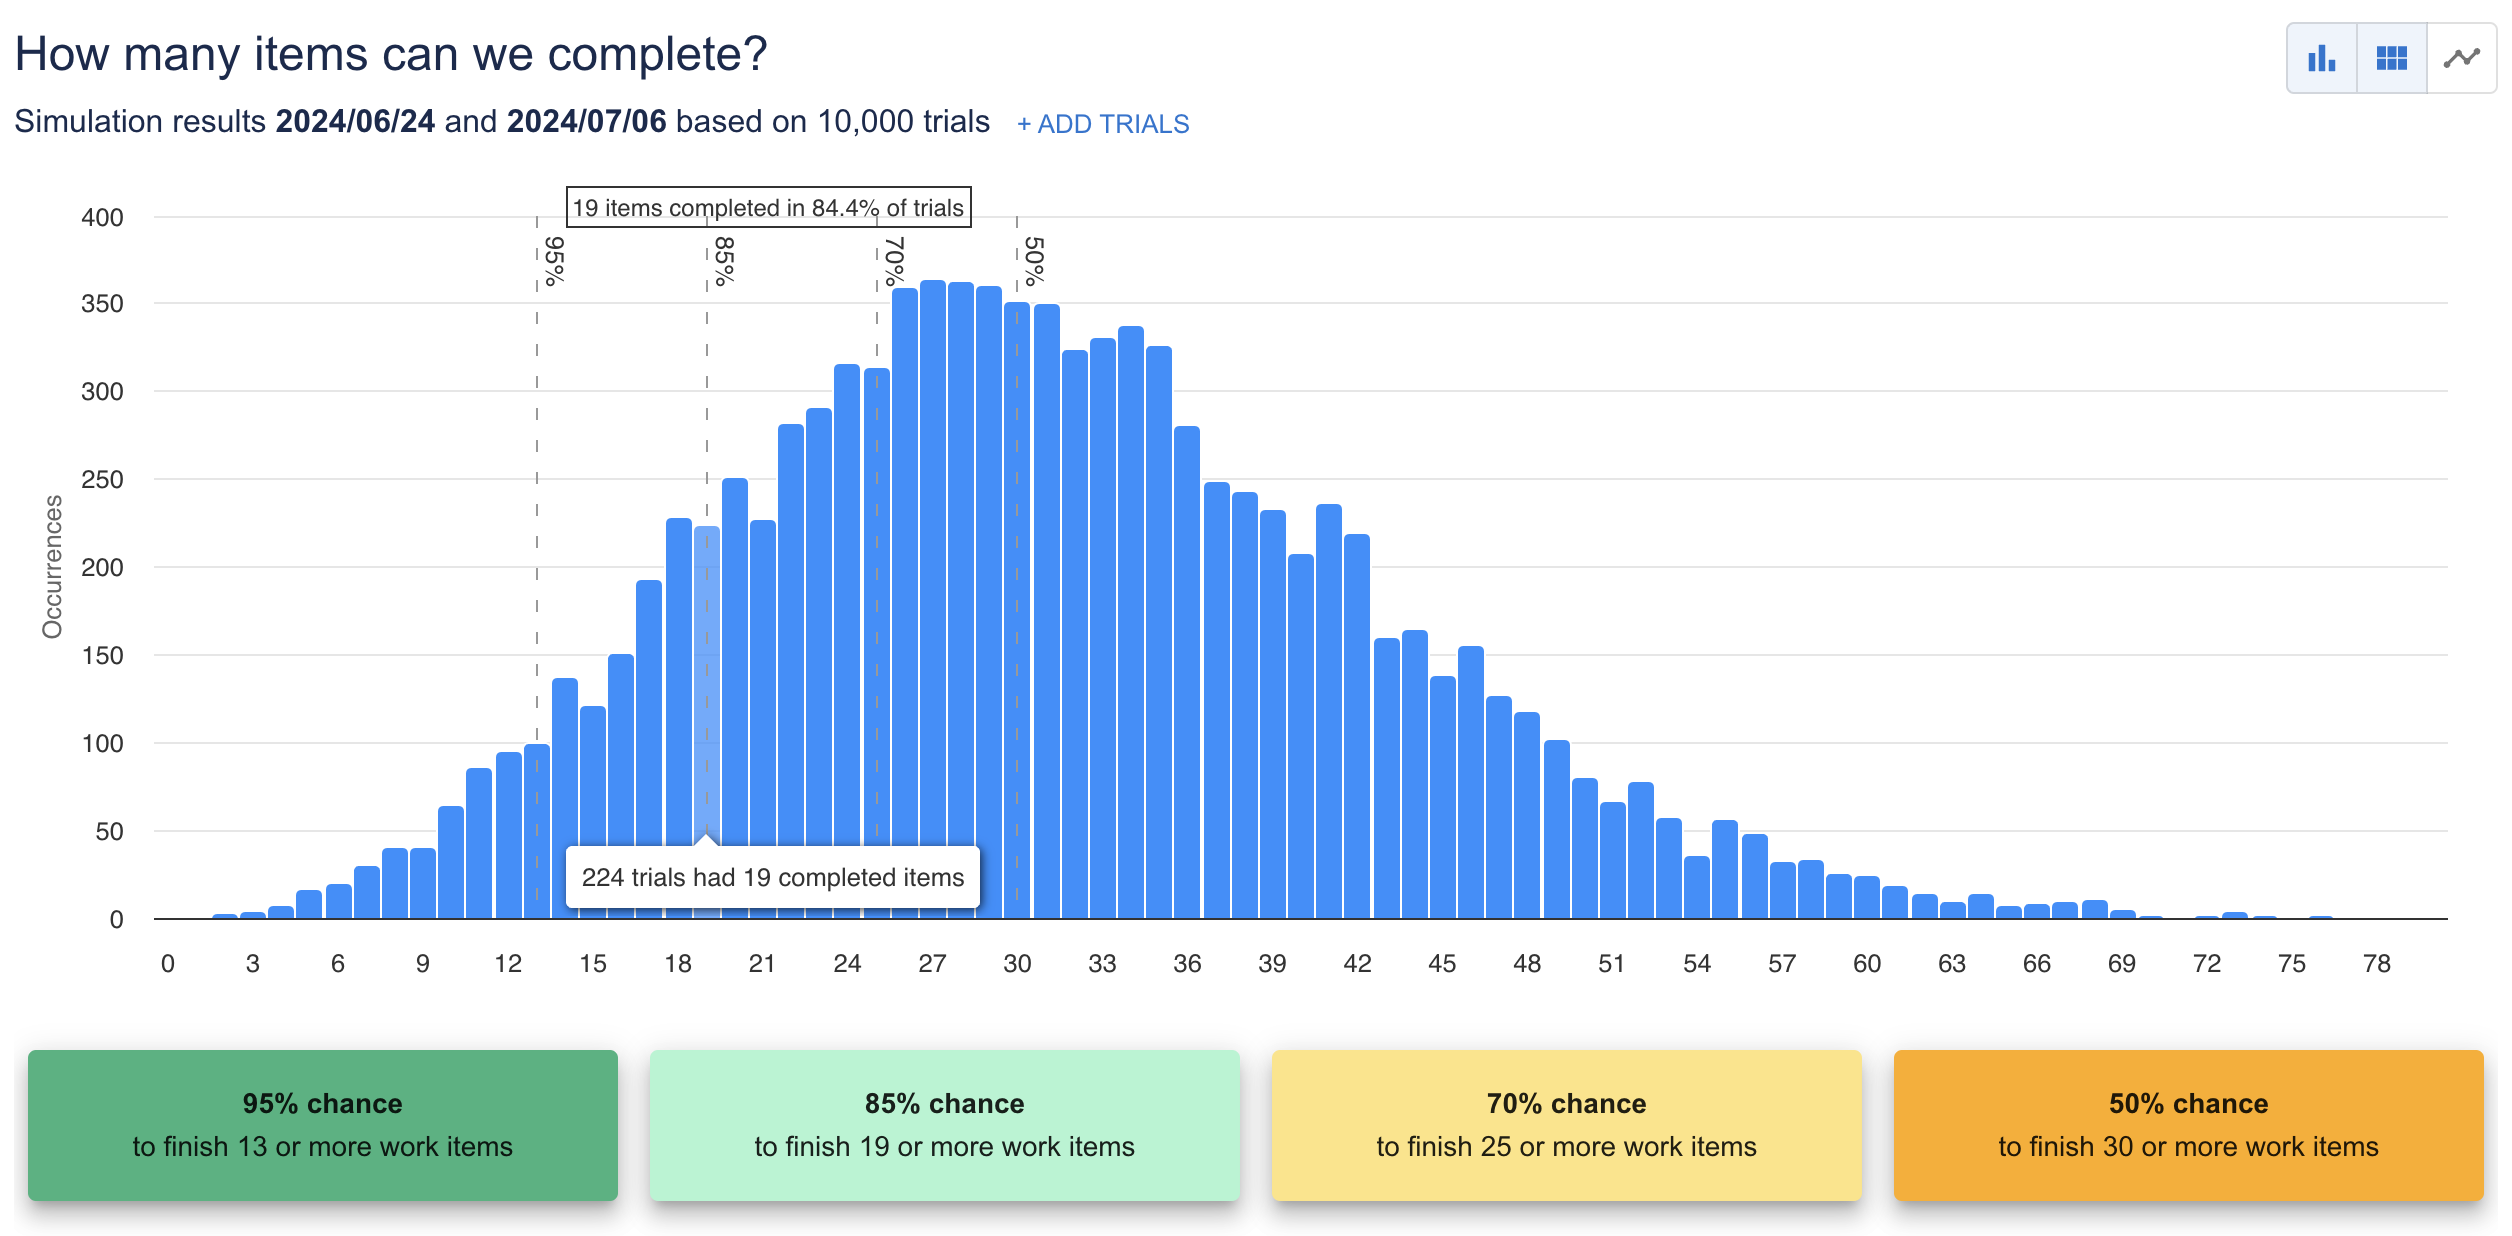
With the data from the image above, I can provide a probabilistic forecast: There's an 85% chance that we can finish 19 or more items by July 6th.
Can I forecast my portfolio probabilistically?
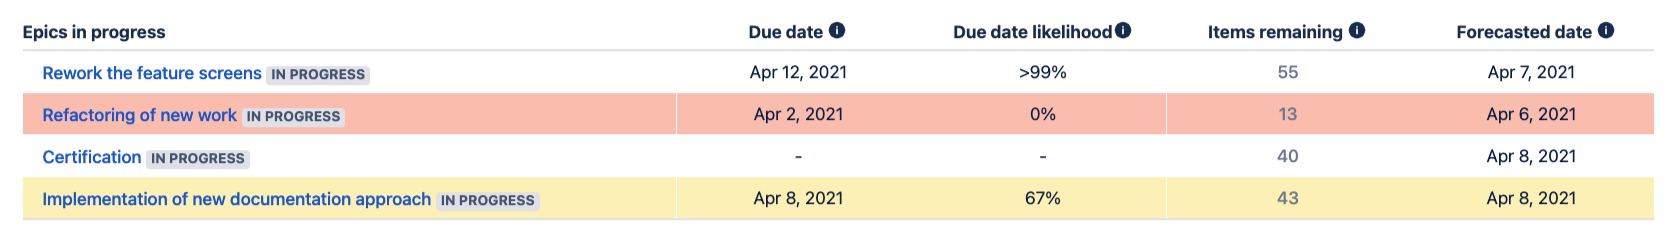
Probabilistic forecasting can be applied at a portfolio level using the same concepts but with some different tooling. At 55 Degrees, we forecast our portfolios using Throughput data and Monte Carlo simulations as explained above but there's an added consideration of how many multiple efforts we have happening concurrently alongside our Throughput and our chosen probability.
Our simulation provides information such as how likely we are to finish a given effort by a fixed date and when we're likely to finish based on what remains in the effort and our recent throughput.
Learn more about our Portfolio Forecaster here.
Forecasting is not a one-time affair
Meteorologists don't just give you a forecast for an upcoming storm when they first hear about it and then leave you without updates, right? You don't check your GPS before you leave to find out how long it will take and then shut it off do you? No, of course not. That would be silly.
You'll absolutely want to re-run your forecasts regularly to see how they are affected by current conditions. This ensures that you find out any shifts as early as possible and minimize late surprises. (Help us make #continuousforecasting trend!)
What are the benefits of probabilistic forecasting?
Simply put, probabilistic forecasts are more inexpensive than traditional methods requiring expert estimation and work breakdown because they take very little time. Because they are cheaper, it is easier for you to provide those needed updates to your forecasts!
Probabilistic forecasts are also more accurate because your data already accounts for factors that we struggle to incorporate into our estimates. Read about the German Tank Problem for an example of this.
Cheaper. More accurate. No-brainer! In fact, as long as we are winning on even just one of those (and not sacrificing too much of the other) then it is worth a switch. But, you don't have to take anyone's word for it. It's easy to start doing probabilistic forecasting alongside whatever methods you traditionally use. That way you can see for yourself what works better for your context.
Want to get started?
You can do all of these forecasts by hand (or with excel). However, it might get a bit tedious. So, of course, 55 Degrees has an app for that and you can try them out for free for at least 30 days (or more depending on your platform). Check out ActionableAgile and Portfolio Forecaster today and reach out to us if you have any questions!
Frequently asked questions
Does all my work need to be the same size?
Many people think that probabilistic forecasting won’t work for them if their work is varied in type or size. Your work doesn’t have to be the same size at all for this to work. Obviously, variation will cause the spread of possible outcomes to be wider. If you're not happy with the spread in the range, you can work to improve your process predictability. This will require you to consider many things about your process, one of which may be right-sizing work.
However, if the data that goes into the Monte Carlo simulation reflects the variety of your work, the generated forecasts will reflect that variety as well. In fact, your data does a better job at reflecting all of the variety across the various conditions that impact your data than you ever could on your own!
My forecast was wrong! What gives?
The words “right” and “wrong” when it comes to forecasts should be re-evaluated. Using the language of probabilities reminds us that something unexpected can happen and disrupt our desired timelines. In truth, the only things we can be certain about are the things that have already been delivered. Outside of that, there is no 100% in a probabilistic forecast. If we said there was an 85% chance we would deliver work in 13 weeks or less and it took us 15, it doesn’t mean that we were wrong. We stated upfront there was a 15% chance that work would take longer.
OK, am I really ready for probabilistic forecasting?
Yes! Any team, even new teams, can use this type of forecasting. This feels like an advanced concept but it really isn’t. It’s just very different than what we’re used to. Don’t have historical data? Use estimates until you finish some work and then switch to using historical data.